New pipeline profiling method helps avoid condensation, black powder
A new method can help avoid condensation and control hydrates in the early stages of a natural gas transmission pipeline’s life, thereby helping avoid future black powder formation.
Locating areas in natural gas transmission pipelines susceptible to condensation of water vapors and higher hydrocarbons, hydrates, and black powder formation, require both temperature and pressure profiles for the gas traveling through these pipelines.
This article describes both a simplified approach for generating these profiles based on earlier work in this area and a procedure to predict soil thickness (responsible for soil resistance to heat transfer), temperature, and pressure profiles.
Background
Black powder formation occurs frequently in natural gas transmission pipelines all over the world but remains poorly understood in terms of its formation, inhibition, or prevention.1 2 The formation chemistry of one major component of black powder, FeS, suggests hydrogen sulfide present in the gas directly reacts with the steel wall of the pipe. Sulfate-reducing bacteria on the pipe wall may also produce hydrogen sulfide. The presence of water promotes this reaction; even a small percentage will greatly accelerate production.
This relationship suggests the importance of controlling the presence of liquid water in the pipe either by reducing the amount of water vapor in the incoming gas or by selecting operating temperatures and pressures sufficient to avoid condensation of any water vapor or higher hydrocarbons present in the gas.
Hydrates form from natural gas in the presence of liquid water provided the pressure is above and the temperature below the equilibrium line of the phase diagram of the gas and liquid water.3 4 Determining if hydrates will form requires accurate pressure and temperature profiles of the gas in pipelines. These profiles can also help determine the viability of line heaters for hydrates prevention (OGJ, Mar. 8, 1971, p. 57), the required inlet-gas temperature at each gas compressor station, and the minimum gas flow rate required to maintain a specific gas temperature at a downstream point.
Modeling equations
Thorough discussion has already occurred of the basic equations governing such systems5 6 and the details for solving these equations can be found in textbooks on numerical analysis.7 Determining the physical properties for calculating pressure drop requires knowledge of pressure and temperature at each point along the pipeline. Generating a usable temperature profile therefore requires a series of complex, interactive calculations. Environmental properties such as soil type and temperature variation along the pipeline between summer and winter complicate these calculations.
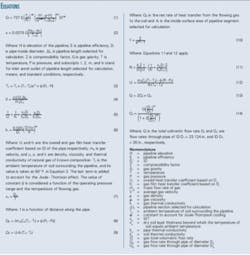
This article uses an integrated simple set of modeling equations with a set of accompanying assumptions. Equations 1 and 2 are the governing mathematical equations for the flow and heat transfer phenomena involved in the prediction of temperature and pressure variations in selected segments of natural gas transmission pipeline.
These equations are known as the revised Panhandle equations and are used for large-diameter, high pressure transmission lines. They are accurate in fully turbulent flow for Reynolds values of 4-400 × 106.
Equations 3-6 can calculate the temperature profile.
This article used a flowing gas temperature and pressure of 70-110° F. and 700-1,200 psig, respectively, with a value of φ of 0.05; equivalent to a cooling of 10° F. for every 200-psig pressure drop.
Equations 5-6 are well known:8 9 xp is the pipe WT and xs is the thickness of the dry soil around the pipeline, beyond which the temperature of the soil equals the ambient temperature. The thermal conductivity of the pipeline material, kp, and of the dry soil, ks, measure 29.0 and 0.075 btu/hr-sq ft-°F., respectively.10-12
Equation 7 approximates the dry soil thickness; i.e., penetration thickness.
As the compressed hot gas flows in the pipe, the heat transfer rate will be highest near the entrance. As the gas cools along the line, the driving force for heat transfer decreases and accordingly the rate of heat transfer to surrounding soil also decreases. This in turn will reduce the penetration thickness along the pipe, suggesting the value of function f increases with distance along the pipe.
Equations 5-9 calculate the function f with experimental temperature and pressure data for different segments of pipeline.
The calculated values of function f support the arguments used in postulating Equation 7. Equations 10-12 also readily expresses function f.
Experimental data
Dividing an operating transmission pipeline into segments of roughly 10 miles each allowed for experimental calculations. Knowing the upstream temperature, pressure, and gas composition allowed Equations 1-7 to be solved successively for these pipeline segments (Fig. 1).
Natural gas after compression at City 1 moved to Point B through three parallel lines; one 35-in. ID and the other two 23.124-in. ID.
Equations 13-14 calculate volumetric flow rates of natural gas through these lines.
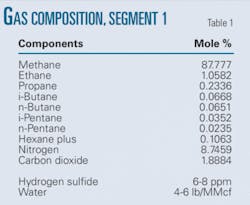
From Point B, the gas flows to City 2, Leg M, Point C, and so on. Table 1 shows composition of the flowing gas.
These calculations used the following assumptions:
- Pipeline elevation’s effect is negligible and the corresponding term in Equation 1 is dropped.
- Upstream temperature at the selected section for calculation is used as mean temperature for estimating various gas properties for the selected length.
- Soil around the buried transmission pipeline is considered dry and the corresponding thermal conductivity value is used.
- Reported pipeline efficiency = 0.8.
- Resistance to flow of heat is confined in a known thickness of dry soil around the pipeline and the temperature of the soil beyond this dry soil layer is assumed to have an ambient temperature of 60° F. Equation 7 estimates this thickness. Function f in this equation depends on the distance along the pipeline, but in view of its relative influence on predicted temperature profiles, a constant value of 3 is used in this article.
- Each segment of pipe has a known upstream pressure and a calculated downstream pressure. The mean value of pressure determines property values13 required to calculate temperature at the downstream end of a pipeline segment.
These assumptions are valid for engineering calculations and should not affect the predicted results.
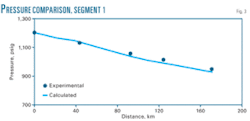
Figs. 2-3 compare the predicted temperature and pressure of gas as it moves through the pipeline with the experimental data.14 The predictions agree with available experimental data.
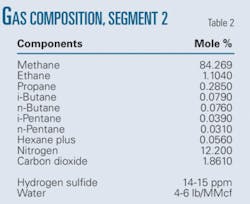
Technicians also applied the procedure to a pipeline segment (Fig. 4) transmitting relatively low-quality gas (Table 2). This line segment is prone to black powder formation and condensation and is being studied to suggest operating conditions to avoid black powder formation.
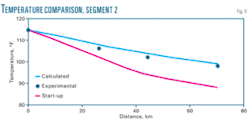
Figs. 5-6 compare computed results with experimental data for temperature and pressure. The computed results again agree with the experimentally measured profiles.
The maximum disagreement of prediction with experimental data for temperature generally measures less than ±5% and pressure less than ±1%.
New pipelines
Newly laid transmission pipelines cool gas faster than pipelines already in use, the resistance offered by soil to transfer of heat increasing with time until it reaches a steady state. Condensation of water vapors and higher hydrocarbons therefore starts high in a new natural gas transmission pipeline and shrinks over time, while black powder formation gradually increases. This circumstance suggests the bulk of damage done to a pipeline occurs at and shortly after start-up and that later efforts can only hope to clean up whatever mess has occurred.
Black powder formation cannot be completely arrested once it has started. The initial operating period of a pipeline therefore requires careful modeling.
The penetration thickness (the dried soil layer of low thermal conductivity) around a newly laid transmission pipeline is essentially zero at start-up and grows during operation until a steady state is reached.
Simulating this state gives the penetration thickness approximated by Equation 7, the thermal conductivity of unaffected soil, 0.38 btu/sq ft-hr-°F.12 Calculated temperature profiles for segments of transmission pipelines studied show faster cooling, with temperature drops below the dewpoints of gases being transmitted.
These profiles, plotted as dotted lines in Figs. 2 and 5, clearly warrant the taking of adequate measures to avoid onset of water condensation during start-up and minimize subsequent black powder formation.
Acknowledgments
The authors appreciate the funding of Sui Northern Gas Pipelines Ltd., Lahore, Pakistan, by way of sponsoring a Chair of Gas Engineering in the department of chemical engineering, University of Engineering & Technology, Lahore, Pakistan. The authors also thank Vice-Chancellor Lt. Gen. Muhammad Akram for his tireless efforts in promoting research activities at the university.
References
- Baldwin, R.M., “Black Powder in Gas Industry—Sources, Characteristics and Treatment,” Report No. TA97-4, Gas Machinery Research Council, Dallas, 1998.
- Pack, D.J., and Chesnoy, A.B., “Unwanted Sulfur Contamination in Natural Gas,” Special Report, Hydrocarbon Processing, July 2007.
- Carson, D.B., and Katz, D.L., “Natural Gas Hydrates,” Trans. AIME, Vol. 146, p. 150, 1942.
- Katz, D.L., and Lee, R.L., “Natural Gas Engineering-Prediction and Storage,” McGraw-Hill Publishing Co., Singapore, 1990.
- Mokhatab, S., Poe, W.A., and Speight, J.G., “Handbook of Natural Gas Transmission and Processing,” Elsevier Inc., 2006.
- Menon, E.S., “Gas Pipeline Hydraulics,” Boca Raton: CRC Press, 2005.
- Constantinides, A., and Mostoufi, N., “Numerical Methods for Chemical Engineers with MATLAB Applications,” New Jersey: Prentice Hall, 1999.
- Coulson, J.M., and Richardson, J.F., “Chemical Engineering,” Vol. 1, London: Pergamon Press, 1962.
- Perry’s Chemical Engineers’ Handbook, 6th Ed., Kosaido Printing Co. Ltd., Japan, 1988.
- Wilkes, G.B., “Heat Insulation,” Chapter 4, New York: John Wiley & Sons Inc., 1950.
- McAdams, W., “Heat Transmission,” New York: McGraw-Hill Book Co. Inc., 1954.
- Staniar, W., “Plant Engineering Handbook,” New York: McGraw-Hill Book Co. Inc., 1959.
- “Gas Encyclopedia,” LAIR UQUID Division, Scientific English Translation by Nissin Marshall, New York: Elsevier, 2002.
- Private communications, SNGPL, Lahore, Pakistan, 2007-08.
The authors
Amjad Hussain Dilawari ([email protected]) has served since June 2007 as professor and chair of gas engineering in the department of chemical engineering at University of Engineering and Technology, Lahore, Pakistan. He received an MS in chemical technology from Punjab University, Lahore (1967). He has worked as a professor, researcher, and consultant since; completing his PhD at Imperial College of Science and Technology, London (1972) and conducting postdoctorate work at MIT and for the US National Science Foundation. Dilawari is a Fulbright Scholar and a member of the Pakistan Engineering Council, the Pakistan Institute of Chemical Engineers, and a founding member of the Macro Engineering Society of Pakistan.
A.R. Saleemi ([email protected]) has served as chairman, department of chemical engineering, University of Engineering & Technology (UET), Lahore, since September 2006. He received a BS in chemical engineering from UET (1975) and an MS in environmental technology and management from the Asian Institute of Technology, Bangkok (1980). He completed his PhD in chemical engineering at the University of Newcastle, Australia (1986). Saleemi became an assistant professor in 1980 and has taught ever since. He has also worked as a consultant to the World Health Organization and is a member of the Pakistan Engineering Council, Pakistan Institute of Chemcial Engineers, and a founding member of the Macro Engineering Society of Pakistan.


