Ovintiv Inc. performed cluster experiments in a Wolfcamp B campaign in Permian basin to determine optimum perforation orientation and cluster spacing. A test well with alternating stage designs was stimulated with oil-soluble tracers in the fracturing fluid to evaluate stage flowback. Perforations were imaged pre- and post-stimulation to compare realized perforation geometries with expected geometries and quantify perforation erosion relative to shot orientation.
Guns were shot at 0° top side and 90°-270° phasing around the well with 150-ft and 300-ft stage lengths. Perforation guns were designed to shoot a 0.42-in entrance hole diameter (EHD), but imaging revealed smaller holes than expected. Subsequent surface-shot experiments produced surface-downhole EHD correlations which optimized a new gun to achieve the desired downhole diameter.
Production analysis based on fiber optic and tracer data showed that the 0° top shot stages had superior performance, and the 150-ft stages outperformed the 300-ft stages on a normalized basis.
Test-well stage sequencing
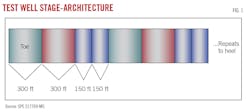
Test Well #1 contained three distinct stage architecture configurations incorporating variations in perforation phasing, stage length, and cluster separation.
Stages varied by the following parameters:
- The first stage spanned 300 ft and contained two shots per cluster with 0° phased perforations along the top of the well.
- The second stage also spanned 300 ft and contained two shots per cluster but oriented the perforations in 90°-270° phasing around the well.
- The third stage spanned 150 ft and contained two shots per cluster with 0° phased perforations along the top of the well.
- A fourth stage repeated the 150-ft stage design. These shorter stages contained half the cluster spacing of the 300-ft stages to address concerns about the small 300-ft stage total flow area compared with a peer group.
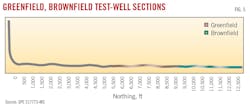
These four stage patterns repeated over a 13,000-ft interval to the heel of the well (Fig. 1). Table 1 summarizes the stage architecture. The number of clusters per stage and cluster spacing lengths, however, were proprietary.
The study was divided into an initial perforation performance evaluation to optimize gun design and selection, and a subsequent production analysis to understand stage design on well performance.
Perforation performance
For the perforation performance evaluation, perforations were imaged downhole to determine perforation geometry before and after fracturing. Identical perforations were shot at surface under no-stress conditions and at ambient temperature in identical casing. Comparisons between downhole and surface EHDs produced correlations between surface test shot results and actual downhole gun performance. Based on these results, a second test well ran modified guns. Comparison of downhole perforation geometry with expected perforation geometry from the modified guns evaluated the accuracy of the correlations.
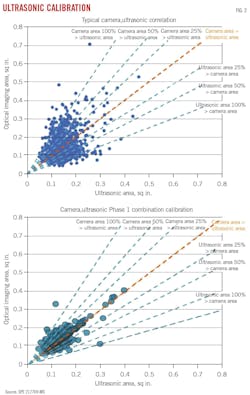
Supplied guns shot a nominal 0.42-in entrance hole diameter. Perforation images were taken pre-frac to determine downhole gun performance and post-frac to determine erosion patterns and fracture treatment uniformity. Both an array camera and a phased-array ultrasonic tool imaged the perforations. Each has advantages and disadvantages: an optical camera requires a clean well and clear fluid for imaging. Ultrasonic tools do not suffer from these limitations, but they typically yield lower resolution images. Debris within the perforations can obscure the ultrasonic image because the tool cannot differentiate between sand and metal at perforation edges. Ultrasonic imaging also requires a consistent toolstring speed to maintain a time value for the image along the wellbore axis. Any variation in speed such as stick or slip will distort the image. Running both in combination mitigates these concerns but requires calibration for the two tools to be complimentary (Fig. 2). Ovintiv imaged 100% of the perforations using both tools with calibration.
Test Well #1 treatment
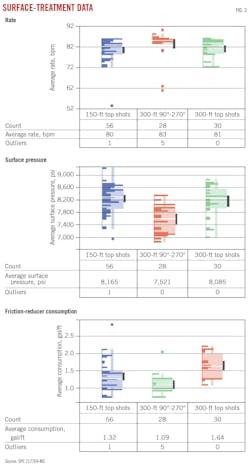
Test Well #1 was stimulated as part of a simulfrac treatment in Wolfcamp B. The second well used the same stage architecture. Fig. 3 summarizes the rate, surface pressure, and friction reducer consumption in the test well. The 300-ft, 90°-270° shot stages averaged higher treating rate, lower treating pressure, and lower friction reducer consumption over the alternative designs. From a treating standpoint, this design saved fuel and chemicals and produced faster completion times than the other stages. It was hypothesized that the perforations in this design were slightly larger than from the 0° top casing shots because the standoff distance between the gun and casing is shorter in 90°-270° phasing. The effects this phasing had on the uniformity of the treatment, and therefore overall treatment effectiveness towards production, was not determined in the perforation evaluation phase of the study.
Table 2 shows the results of perforation imaging, both prefrac and postfrac. As expected, 90°-270° pre-frac shots were larger by 0.73 in. on average than the top shot designs due to stand off. For the same reason, top shots also exhibited about 30% smaller diameter than the expected 0.42-in. EHD. The 90°-270° shots were about 12% smaller than expected.
Post-frac imaging standard deviation analysis showed that erosion was uniform regardless of shot density or orientation, but erosion among the stage designs differed between the 0° and 90°-270° shot orientations. The 0° top shots with smaller initial EHD diameters eroded more than the larger 90°-270° hole diameters. This higher erosion is not inherent to top shot perforations, but instead due to the smaller diameters and resultant higher perforation friction resulting from the larger gun clearance between the casing top and the gun body relative to the 90°-270° shot geometry. Surface testing can address these issues to produce more accurate downhole perforation diameters for any orientation.
Surface-gun testing
Four different charges were tested inside a 6-in. casing at surface. The goal was to find a configuration which achieved a downhole 0.33-in. EHD in similar casing. Test charges included the incumbent 0.42-in. charge, an altered 0.42-in. test charge, a 0.485-in. test charge, and a 0.54-in. test charge. Charges were placed in 2-shot-per-gun and 3-shot-per-gun configurations to test for multiple-shot interference effects. All were oriented at 0°. After firing the guns, calipers measured perforation diameters outside the casing, and a camera measured diameters from inside the casing.
Analysis of the shots showed that camera measurements were always smaller than caliper measurements, but the standard deviation and error of the measurements were comparable. The 3-shot guns produced larger holes than the 2-shot guns, and the test charges shot more consistent diameters than the incumbent charge. The test charges also produced more beveled entry holes than the incumbent charge.
The data show that charges shoot about 30% smaller than claimed under stress and about 20% smaller than claimed with no stress in 6-in. casing. The test 0.42-in. charge shot larger than the 0.42-in. incumbent charge by about 2% in 2-shot guns and 7% in 3-shot guns. A correlation based on these results, combined with test well image data, established a surface hole size required to achieve a downhole 0.33-in. EHD with 3-shot guns and 0.37 in. EHD with 2-shot guns.
Test Well #2
Based on Test Well #1 perforation design work, downhole imaging of perforations in Test Well #2 validated the perforation design workflow. The completion was designed to have 0.33-in. EHD in 5.5-in. casing with 3-shot guns shooting at 0° along the top of the well. This casing size was different to that in Test Well #1, and part of the validation included the ability of the correlations to make accurate adjustments based on casing size and grade. The tool predicted that a new charge which shot a 0.381-in. EHD perforation at surface would produce the desired 0.331-in. EHD perforation downhole.
Eighteen pre-frac perforations were imaged at the heel. Table 2 lists the results of the images. The average diameter was 0.33 in. as planned, with standard deviation and error like those observed in Test Well #1.
Perforation plugging
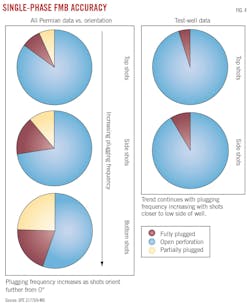
Fig. 4 illustrates perforation plugging observed in Test Well #1 and all Ovintiv’s Permian basin perforation camera image datasets. The data include top shots (0° with ±45° variance), side shots (90°-270° with ±45° variance), and bottom shots (180° with ±45° variance). Post-fracked perforation plugging increases as they get closer to the bottom of the casing, indicating that the 0° top shots are the least susceptible to plugging and, once the perforation diameter issues were resolved with the surface testing and correlation tool, could produce engineered perforation diameters to meet limited-entry perforation friction requirements.
Stage production
Carbon fiber rod and calibrated tracers measured stage production performance along the lateral. Water-soluble tracers stayed in the frac fluids and were pumped to maintain constant concentration throughout the entire fracture treatment. The water-soluble tracers in this study were only included to ensure that the toe-most test stages were producing, therefore these tracers were only added in the first four stages of the completion. Oil tracers, by contrast, were deployed throughout the slurry for uptake into the oil-based reservoir fluids to reveal stage production allocations upon flowback.
High-frequency accelerometer data evaluated geological lateral variability by providing rock properties, minimum horizonal stress, and depletion data. Pore-pressure estimates were derived from geomechanical properties. These data isolate stage architecture designs from reservoir variability in the production analysis.
Test Well #1 contained 56 oil-traced stages completed by the plug-and-perf stimulation technique. Traced stages included 14 stages with 300 ft, 0° top shots; 14 stages with 300 ft, 90°-270° shots; and 28 stages with 150 ft, 0° top shots, yielding equally traced laterals 4,200 ft in total with 3,200 g of tracer per test stage. Tracer sampling extended over a year to measure statistically significant concentrations.
The test well was an infill next to parent wells which had been online for about 3 years at the time of the test well completion. The parents affected the middle and heel sections of the test well. An additional oil tracer pumped in toe stages 1-16 (greenfield) and a separate oil tracer pumped in stages 18-33 (brownfield) elucidated performance differences between the undepleted and depleted sections, respectively (Fig. 5). No additional tracer was pumped in the bottom third of the lateral.
Fiber optic runs were timed to capture multiple flow and shut-in intervals before an extended warmback period. A two-phase gas and liquid temperature model adjusted for pressures below bubble point. Acoustic and temperature profiles recorded over an initial stabilized 4-hr production period provided baseline fiber responses before changing rate. A subsequent 4-hr shut in resulted in minimal warmback but provided a quiet wellbore for an acoustic baseline. This was repeated with short shut-in sequences to evaluate cluster-level behavior.
After these baseline tests, a 24-hour warmback period produced an initial stabilized temperature and acoustic baseline. The well was brought online and subsequent flow transitions evaluated cluster productivity and lateral production.
Stage production analysis
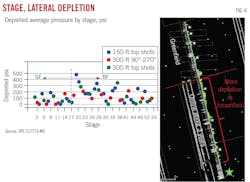
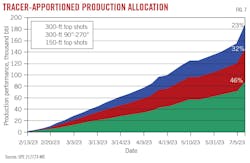
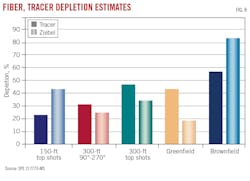
Fig. 6 shows pore pressure depletion across the brownfield and greenfield areas in the test well lateral. Parent wells are shown in the lower left part of the figure, and stars denote vertical producers. Depletion estimates correlate with the expected brownfield area depletion from the parent wells. The 150-ft, 0° top shot stages produced higher depletion in both brownfield and greenfield areas than the 300-ft stages, and the 300-ft, 0° top shot stages have somewhat higher depletion than the 90°-270° shot stages in the greenfield area. The data are evenly mixed between the latter two in the brownfield area. Fig. 7 shows that that 300-ft top shot stages dominated production with 47% contribution followed by the 300-ft, 90°-270° shot stages (31%) and 150-ft top shot stages (22%). Brownfield outperformed greenfield by 7% overall. Water-tracer sampling confirmed flow from toe to heel.
Temperature and acoustic fiber flow allocation indicated heel dominated flow, with the first third of the lateral accounting for half the total flow. Flow reduction in the last third of the well may be due to water loading in the sump of the lateral, further complicating greenfield vs. brownfield flow analysis.
Comparing overall stage production, fiber data suggest 150-ft top shot stages produced 50% of total gas and 43% of total liquid, followed by 300-ft top shot stages (28% gas and 32% liquid) and 300-ft, 90°-270° shot stages (22% gas and 25% liquid). These results match the depletion analysis for the greenfield stages in Fig. 6. Normalized to 300-ft, the 150-ft stages produce almost twice as much per lateral foot.
Depletion, fiber, camera, and tracer data show different allocations of production due to different interpretations of the data types. The depletion log showed more depletion in the middle and heel sections, but this depletion was dependent on parent-well proximity. Fiber-rod data correlated depletion and stage performance and showed that depletion (or lack thereof) was not the driving force for production. All stage designs generally fell within the same range of depletion with higher average depletion of all stages towards the heel. Any production impacts from depletion were overshadowed by the preferential production towards the heel.
Post-fracturing camera and ultrasonic analysis did not show any correlations between erosion and flowback performance. All designs generally eroded uniformly with a few exceptions among the 150-ft top shot stages. These stages were among the lower producers, suggesting that the higher erosion resulted in loss of limited-entry advantages.
Both methods suggest brownfield production exceeded greenfield production, and as noted, this may be due to the water sump interfering with production from the bottom of the well, compounded by errors introduced with the constant WOR assumption. The fiber rod did not deploy to Stages 1 and 2, getting stuck halfway in Stage 3, and the first two stages are not included in the fiber rod’s greenfield production analysis.
Overall, although no one method yielded confirmed production allocations, and some allocation approaches conflicted with others, top-aligned perforations in 300-ft or 150-ft stages provided the best production performance. Fiber data showed that the 150-ft clusters provided the highest normalized production out of the three designs. Although the 300-ft, 90°-270° shot stages produced superior pumping characteristics (higher rate, lower pressure, lower friction reducer consumption), these advantages did not translate to superior flow performance from the stages.
Based on “Perfectly Stressed Out: Surface and Downhole Imaging Relations,” SPE-217769-MS and “Tying Stage Architecture to Wolfcamp Performance,” SPE-217773-MS, SPE Hydraulic Fracturing Technology Conference and Exhibition, The Woodlands, Tex., Feb. 6-8, 2024.
About the Author
Alex Procyk
Upstream Editor
Alex Procyk is Upstream Editor at Oil & Gas Journal. He has also served as a principal technical professional at Halliburton and as a completion engineer at ConocoPhillips. He holds a BS in chemistry (1987) from Kent State University and a PhD in chemistry (1992) from Carnegie Mellon University. He is a member of the Society of Petroleum Engineers (SPE).
