New NMR approach evaluates tight gas sand reservoirs
A new approach for evaluating neutron magnetic resonance (NMR) logs can determine permeability in tight gas reservoirs. The bulk gas-magnetic resonance permeability (BGMRK) has the same value in oil-based (OBM) and water-based (WBM) muds because it depends on gas reentry to the flushed zone after a mud cake is formed and mud invasion stops.
Analysis of tight gas sand reservoirs is difficult. Many tight formations are complex, producing from multiple layers with different permeabilities that natural fractures often enhance. Well-logging techniques, such as NMR as standalone logs or in combination with conventional openhole logs, provide new interpretation methods for obtaining the representative reservoir characterizations.
NMR logs
NMR logs differ from conventional neutron, density, sonic, and resistivity logs because the NMR measurements provide mainly lithology independent detailed porosity and are a good hydrocarbon potential indicator. NMR logs also can determine formation permeability and capillary pressure.
Evaluators have used these NMR applications in a gas sand reservoir with different facies and permeability variations from less than 0.1 md to more than 100 md. Evaluation techniques include:
- Combining NMR and bulk density data to reduce uncertainty in porosity.
- BGMRK approach that provides a simple facies independent model to calculate permeability.
Gas-condensate reservoir
The example that shows the use of the BGMRK approach is for a gas -condensate field producing from a Lower-Mesozoic reservoir. The reservoir is a tight heterogeneous gas shaly sand reservoir. It suffers from lateral and vertical heterogeneity due to diagenesis effect (kaolinite and illite) and variations in grain size distribution.
The petrophysical analysis indicates a narrow 8-12% porosity range while permeability ranges from 0.01 to 100 md.
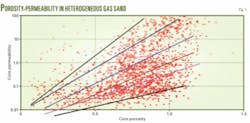
Fig.1 shows core porosity-permeability cross plot of the entire reservoir section including all facies in different wells. The core data indicate a cloud of points with an undefined trend, so that it is subdivided into six subunits.
In heterogeneous reservoirs, facies may change every few meters or a few centimetres. The average fluid density in this case becomes unsatisfactory; therefore, the evaluation requires a new porosity-determination technique independent on facies change.
Due to reservoir heterogeneity, the field has many cores in different wells covering different reservoir units to create the proper porosity-density and permeability model. The uncertainty associated with identifying the proper porosity and permeability model for each unit is high, which could result in high-permeability estimation.
Integration on nonstandard tools such as the NMR with conventional tools and SCAL is essential to reduce the uncertainty beyond the limits of each tool, especially in gas reservoirs.
The aim is to establish facies independent porosity and permeability models and avoid use of the lithology-independent T2 cut-off.
The advantage of an NMR tool is that it is sensitive only to hydrogen and fluid protons and no borehole correction is needed whenever the radius of investigation is beyond calliper measurements.1-3
The evaluation includes:
- Application of the density magnetic resonance porosity (ϕDMR) technique for calculating porosity.
- Bulk gas magnetic resonance permeability (KBGMR), for calculating permeability beyond the oil-based mud filtrate invasion.
ϕDMR
Traditional evaluations rely on porosity logs, mainly density and neutron. Porosity logs measurements require environmental corrections and are influenced by lithology and formation fluids. The porosity derived is the total porosity, which consists of producible fluids, capillary bound water, and clay-bound water. NMR, however, provides lithology-independent porosity and includes only producible fluids and capillary-bound water.
In heterogeneous reservoirs with mixed or unknown lithology, NMR is accurate for porosity determination.4 5
Freedman et al.6 proposed a combination of density porosity and NMR porosity (ϕDMR) to determine gas-corrected formation porosity and flushed-zone water saturation (Sxo).
The density-NMR cross plot is superior to the density-neutron cross plot for detection and evaluation of gas shaly sands. This superiority is due to the effect of thermal neutron absorbers in shaly sands on neutron porosities that cause too high neutron porosity readings. As a result, neutron-density logs can miss gas zones in shaly sands.7 On the other hand, NMR porosities are unaffected by shale or rock mineralogy and therefore the density-NMR (DMR) technique is more reliable for indicating and evaluating gas shaly sands.
The equation box shows the derivation for the NMR porosity, ϕDMR. It is assumed that both density and NMR tools read within the same gas flushed zone.
Calibrating ϕDMR
A curve-fitting method was used to calibrate the A and B constant values that are applied to the reservoir. In the example, Well A was selected in which both core and NMR data were available over the same reservoir interval. If we assume core porosities equal ϕDMR, which is the gas corrected porosity, Equation 5 can be written as Equation 6.
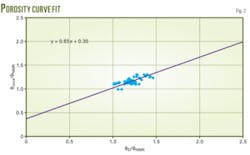
The equation is linear with an intercept at B and the slope equal to A (Fig. 2).
Note that at Sgxo = 0, the pores are completely filled with liquid (mud filtrate and irreducible water) so that the NMR porosity reading and density-porosity should be correct and both should equal the core porosity. As a result, the trend line should intersect at a control point, where
Fluid density for apparent a ϕD estimate is best fit at 0.9 g/cc, which is a combination between formation-water density and mud-filtrate density (OBM). The fitted trend line has a slope of A = 0.65 and intercepts the Y axis at B = 0.35, which results in DMR porosity transform as follows:
ϕDMR results
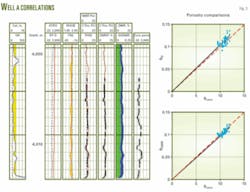
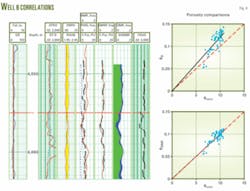
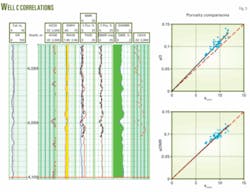
Figs. 3-5 show that the results of the ϕDMR transform applications in three wells (A, B and C) have good matches between ϕDMR and core porosities. As a result, it is considered as an independent facies porosity model. These corrected porosities can be used in conjunction with Timur-Coates equation to estimate accurate permeabilities in gas bearing formations.
null
null
Figs. 3-5 well logs show ϕD and ϕDMR. Gamma ray and caliper curves are in the first track (GR and CALI). The second track shows depth in meters and the third is resistivity. The fourth track has the neutron-density logs, the fifth track compares core, density, and ϕDMR, the sixth track compares ϕDMR and core porosity, the seventh track shows gas saturations (green shadow) and water (blue shadow), and the last track shows core permeability in md.
The DMR method has the advantage of avoiding the use of fluid density and gas hydrogen index (HI) at reservoir conditions for the gas correction. Another advantage is that the logging speeds can be higher because full polarization for gas is not needed.
KBGMR
Permeability derives from empirical relationship between NMR porosity and mean values of T2 relaxation times. The industry uses two permeability models. The Kenyon model K = c x (ϕNMR)a x (T2)b is affected by gas and OBM filtrate (non-wetting phase), and the Timur-Coates model K = (ϕNMR/ c)a x (BVM/BVI)b is affected by uncertainty of bulk volume irreducible (BVI) cut off values and wettability alteration by the OBM filtrate.
The next step after defining T2 cut off values is to calibrate the fitting parameters (c, a, and b) for the studied gas shaly sand reservoir.
Permeability determination with the Timer-Coates model in the case of tight heterogeneous gas shaly sand was unsatisfactory due to the effect of rock facies and tightness and the significant variation of T2 values for the same facies. Estimates of Kenyon and Timer-Coates permeability both are affected by hydrocarbon and development of a new model was needed to develop a different permeability model.8-11
Bulk gas magnetic resonance permeability (KBGMR) is a new technique for permeability estimation in gas reservoirs. It has the same value in oil-based (OBM) and water-based (WBM) mud because it depends on gas reentry to the flushed zone after a mud cake forms and filtrate invasion stops.
The model is a dynamic concept of gas movement behind the mud cake as a result of formation permeability, gas mobility, capillarity, and gravity forces. Because gravity forces are constant, capillarity depends mainly on permeability and mobility depends on permeability and fluid viscosity that is constant for gas. The gas reentry volume is directly a function of permeability.
Bulk gas volume
Several techniques can calculate the gas volume in the flushed zone:
- Differential spectrum (Delta Tw), multi acquisition using different waiting times (Tw)
- Diffusion measurements, 2D fluid analysis using fluid diffusivity (D) and T2 spectra.
Freedman, et al.6 has mathematically developed the transform (Equation 7) for gas volume calculation in the invaded zone.
A simple transform delivered from density-tool response (Equation 2) using DMR porosity is as a corrected gas porosity value shown as Equation 9.
Gas volume is calculated approximately by ignoring the gas response in the NMR measurements especially in short TW, and then the approximated gas saturation in the invaded zone is as follows:
BGMR permeability results
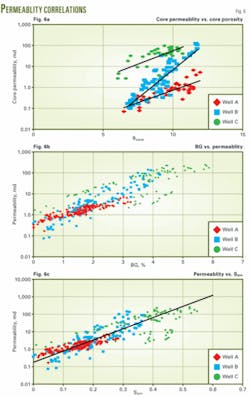
Fig. 6a shows core permeability vs. core porosity x-plot. It reflects how the permeability varies between facies within same the porosity range. The method uses the bulk-gas volume calculation. The method is very simple and excludes any complications (BG = ϕDMR -ϕNMR).
The same method is applied for the three wells A, B, and C, and then BG is plotted vs. formation permeability in Fig. 6b. The correlation is normalized (Fig. 6c) by dividing the gas volume by the total porosity of DMRP to be equal to Sgxo (Equation 10).
The correlation between Sgxo and permeability (Fig. 6c) resulted in the permeability transform, shown as Equation 11.
This transform is facies independent and the statistical analysis of absolute error for this correlation is about a factor of 2. This is acceptable from an uncertainty-assessment point of view compared to permeability uncertainty assessment from core por-perm transforms in the same reservoir, where the uncertainty factor ranges from 1.5 to 3, depending on facies.
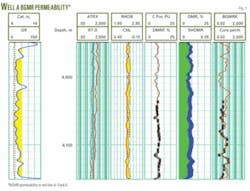
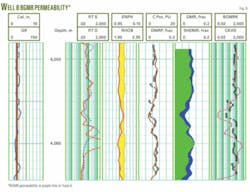
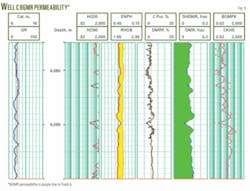
Permeabilities derived with Equation 11 in three wells (A, B, and C) all showed a good match between KBGMR permeability with core permeability (Figs. 7-9).
null
null
null
Acknowledgment
The authors would like to thank King Fahd University of Petroleum & Minerals for supporting this research and Bapetco for providing well logging data used.
References
- Minh, C.C., et al., “Integration of NMR with other openhole logs for improved evaluation,” Paper No. SPE 49012, SPE ATCE, New Orleans, Sept. 27-30, 1998
- Ayala N.M., et al., “New integrated application using T1 and T2 modes of magnetic resonance in tight gas reserve A case study from Northern Mexico,” Paper No. SPE 107634, SPE Latin America and Caribbean Petroleum Engineering Conference, Buenos Aires, Apr. 15-18, 2007.
- Hamada, G.M., et al., “Nuclear magnetic resonance log evaluation of low resistivity sandstone reservoir by-passed by conventional logging analysis,” Paper No. SPE 64406, SPE Asia- Pacific Oil & Gas Conference, Brisbane, Australia, Oct. 16-19, 2000.
- Coates, G.R., et al., “Applying total and effective NMR porosity to formation evaluation,” Paper No. SPE 38736, SPE ATCE, San Antonio, Oct. 11-14, 1997.
- Riviere, C., and Roussel, J.C., “Principle and potential of nuclear magnetic resonance applied to the study of fluids in porous media,” Revue IFP, Vol. 47, pp. 503-23.
- Freedman, R., et al., “Combining NMR and density Logs for Petrophysical Analysis in Gas-Bearing Formations,” Paper No. II, SPAWLA 39th Annual Meeting, Denver, May 26-29, 1998.
- Abushanab, M.A., et al., “DMR technique improves tight gas sand porosity,” OGJ, Dec. 16, 2005, pp. 12-16.
- Galarza T., et al., “Pore-scale characterization and productivity analysis by integration of NMR and openhole logs-A verification study,” Paper No. SPE 108068, Latin American and Caribbean Petroleum Engineering Conference, Buenos Aires, Apr. 15-18, 2007.
- Kenyon B., et al., “Nuclear magnetic resonance imaging-technology for 21st century,” Oilfield Review, Autumn, 1995 pp. 19-32.
- Sen P.N., et al., “Surface-to-volume ratio, charge density, nuclear magnetic relaxation and permeability in clay-bearing sandstones,” Geophysics, Vol. 55, No. 1, 1990, pp. 61-69.
- Singer G.M., “Fast NMR logging for bound fluid and permeability,” Paper No. YY, SPWLA 39th Annual Meeting, Denver, May 26-29, 1998.
The authors
Gharib M. Hamada ([email protected]) is a visiting professor in the petroleum engineering department, King Fahd University of Petroleum & Minerals, Dhahran. Previously he was Cairo University, Egypt, King Saud University, Riyadh, Technical University of Denmark, Copenhagen; and Sultan Qaboos University, Muscat. His main research interests are well logging, formation evaluation, and applied geophysics. Hamada holds a BS and an MS in petroleum engineering from Cairo University and a DEA and a D’Ing. in applied geophysics from Bordeaux University, France. He is a member of SPE, SPWLA, SCA, and DGS.
Mahmoud Mohamed Anwar Abu Shanab ([email protected] and maboshanab [email protected]) is a reservoir petrophysics engineer at BAPETCO, a joint venture of Egyptian General Petroleum Corp. and Shell Egypt. His interests include well log data analysis, field development studies, and application of new and advanced logging techniques. Abu Shanab holds a BS in petroleum engineering from Suez Canal University, Suez, Egypt. He is an SPE member.
Moustafa E. Oraby (Moustafa.Oraby@ Halliburton.com) is the regional manager in the Middle East for Sperry-Sun, a unit of Halliburton Energy Services. He previously worked for ARCO Exploration and Production Technology Co. Oraby holds a BS and an MS in nuclear engineering from Alex University, Egypt and a PhD in log modeling and simulation from North Carolina State University. He is a member of SPE and SPWLA.
