Real-time well engineering predicts drilling friction, aids logging
Real-time streaming well data monitors drilling performance and aids drilling decisions using web-based drilling models to calculate and predict drilling parameters. These models improve rate of penetration, drilling safety, and efficiency.
Halliburton Co. created a real-time well engineering (RTWE) service which uploads drilling data to a cloud-based engineering webapp. The app predicts friction factor (FF) uncertainty about 500 ft ahead of the bit and sends alerts for conditions that vary from the planned well path. Mechanical specific energy (MSE) is also evaluated and displayed in real time based on imported drilling parameters. The webapp live-streams drilling data worldwide, and multiple wells are simultaneously hosted.
SLB developed a webapp to predict gamma ray (GR) log responses from streamed drilling data using a physics-informed machine learning (PIML) web service. The service helps drillers and geoscientists determine in real time what formation type the drill bit is cutting and guides predictive directional drilling well paths. The service reduces cost and time associated with running logging while drilling (LWD) tools or post-drilling logs.
Real-time drilling uncertainty
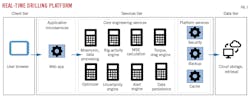
Fig. 1 shows the architecture of the RTWE which contains a client tier, service tier, and data tier. The client tier is on the user’s browser and accesses real-time data, historical data, model parameters, and processed results. Previously run cases, alerts, and cloud communication are also hosted and accessible in this tier.
The service tier includes web applications, core real-time drilling microservices, and platform microservices. Core microservices perform mnemonic and data processing and real-time torque-and-drag and uncertainty analysis. It also includes rig-activity detection, MSE analysis, friction factor uncertainty, and alerts. This architecture also host other drilling applications such as well path anti-collision modeling, rate-of-penetration (ROP) optimization, and early kick detection.
Platform microservices handle cybersecurity, data streaming, and caching. They also transfer data to the database tier backup and provides warm restarts. A multi-cloud support service provides data-tier storage. The service was chosen for its high availability through replica sets (data redundancy) and fault tolerance against loss of a single database server. The data persistence microservice backs up all data to the storage database, and the database client microservice interfaces with the database.
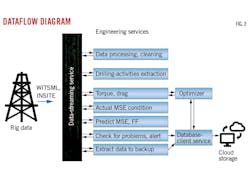
Fig. 2 shows data flow through the microservices. Either InSite or WITSML formats are available for data transfer from the rig. Connectivity is through satellite or cellular service. The mnemonic and data-processing microservice cleans and processes real-time sensor data from noise or missing data. Drilling activities are sensed and represented as macro activities (drilling, trip in, and trip out) and micro activities (rotary drilling, slide drilling, and making connections). Once rig activities are identified, an optimization routine provides the optimal subsurface-friction-factor by comparing hook load calculated with the engineering engine and real-time measured hook load. The weight of the bottom hole assembly (BHA) and drill string is determined while rotating off bottom. Block weight is calibrated while on in-slip state.
Calculated torque and drag trends while drilling and tripping monitor drilling performance. The uncertainty microservice forecasts FF and MSE trends. FF is one of the key indicators to predict downhole conditions, and deviation of actual FF from planned FF produces alerts.
For potential failures, the alert engine provides Normal, Warning, and Problem alerts based on friction-factor deviations from planned values. For Warning or Problem alerts, the system points to the depth of the potential risk. This overwatch increases drilling efficiency and anticipates catastrophic failures.
The user interface shows an overview of all the wells assigned to a specific user and links to them, showing well status, GIS map location, and well cards. The service shows whether the operation is running as planned or if there are problems assigned to the well. Well cards can be sorted by severity of operation or alphabetically to review persistent issues. The homepage summarizes alerts received from each module over the past 3 days and highlights wells needing attention.
The torque-and-drag page includes the well list, well-data dialog box, rig activity, case list, formation dialog box, string-weight dialog box, FF chart, well schematic, formation details, hook-load chart, torque chart, and MSE chart. Engineering calculations use planned wellbore trajectory, BHA, drilling string, drilling fluid, and simulation option input from well-planning software. The FF chart shows computed and planned FF on a relative scale. RTWE predicts FF uncertainty about 500 ft ahead of the bit and provides an uncertainty cone.
RTWE also calculates MSE and graphically displays the results. A cone of MSE uncertainty derives from 100 previous MSA calculation points and predicts the next 50 points.
Following the predictive analyses, alerts are sent on a case-by-case basis. For example, excessive FF may indicate imminent stuck pipe, and long connection times show where excessive non-productive activities occur.
Other services in the well-data dialog include an intelligent algorithm to determine optimal fluid-filled depth based on mud weight for filling drill pipe, and auto-calibration to correct block weight if default block weight is in error.
Real-time logs
SLB combined physical models with data-driven machine learning (ML) algorithms to produce a PIML model which generates synthetic gamma ray (GR) logs from real-time drilling data. Offset well data trains PIML models on the relationships between drilling parameters and gamma ray logs. The method assumes direct relationships between GR and rock formations in the training dataset and assumes that offset well-log responses to formation distribution are analogous to the subject well.
The primary training dataset came from Permian basin wells. Validation tests were performed by removing one well from the set as a subject well and modeling its GR log based on data from the other four. The modeled log was then compared with the actual GR log to test model accuracy. The tests were repeated for each of the other wells.
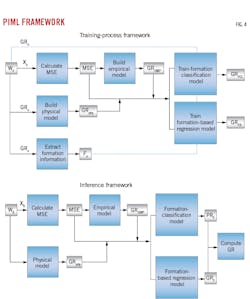
Fig. 3 illustrates the synthetic GR log process. Subject well (Ws) gamma ray logs (GRs) come from offset well (Wo) and Ws drilling parameters (Xo and Xs, respectively) and GR logs from offset wells (GRo). Xs are recorded in real time during the drilling process to yield real-time GR logs.
GR and drilling measurement relationships vary with formations and regions, requiring only analogous offset well data. With changing sets of offset wells, however, different drilling-formation relationships arise, and the model needs to account for this. The current work breaks the model into two stages; the first stage determines GR-formation relationships in the underlying rock formations, and the second stage determines GR-surface drilling parameter relationships. Separating the two focuses the model on strict physics-based guidelines for GR logs, preventing excursions outside physical reality from drilling-parameter curve fitting that can violate log physics. It also makes the model more generally applicable.
In the training workflow, MSE calculated for all wells establishes the relationship between rock formations and drilling parameters. Formation information is extracted (Fo) from offset well data using formation tops to identify formation changes in log responses. A single GR log is broken down into multiple segments, and formation labels are assigned to specific points in the log based on time-series clustering, where similarly shaped time-series elements are grouped together. Prior regional GR-formation information is also included in the formation analysis. Real-time probabilistic labels identify uncertainty between formation-top predictions and earlier information.
A physics module estimates GR response (GRphy) based on average GR values across all offset wells with respect to trajectory, MD, and TVD. The average representation is mapped in real time to the subject well based its planned trajectory. An empirical model simultaneously computes GR response based on statistics (GRemp). It is not an ML model; it simply uses input data to produce GR estimates based on correlation to observed drilling parameters. Both empirical and physics-based GR responses train a formation classification model and a formation regression model.
Model training
Given drilling parameters, MSE, Fo, GRphy, and GRemp, the formation classification model trains to predict formation classes at each depth (Fig. 4). The model produces probabilities of accuracy for each formation class along the well path. A regression model trained on each of the corresponding formation classes extracts formation-based GR logs (GRFR). The final predicted GR logs (GRs) are calculated either unweighted or weighted. The unweighted estimate produces GR logs corresponding to the GR response of the formation class with maximum probability at each depth. The weighted GR log estimate is the sum of the product of probability of each formation class multiplied by the GR response for each formation class estimated by the regression models at each depth.
Model validation
The subject well was drilled in the Permian basin, and the training well dataset came from the same location. A group of five wells was chosen based on similarity among GR logs and to subject-well geology. Depth-indexed drilling data recorded at regular depth intervals included MD, surface weight on bit, hook load, rpm, rate of penetration, torque, and standpipe pressure.
Data validation ensured consistency by removing GR outliers from the 0-200 API range. Unwanted noise was removed, and missing data were filled in using backward fill, forward fill, and interpolation imputation techniques based on the best method for a particular feature evaluated through root-mean-square error analysis (RMSE). Different models were trained from validated offset-well data using open-source ML libraries. Leave-one-out validation was performed for each of the wells, where four stood for offset wells and one as the subject well.
Validation results
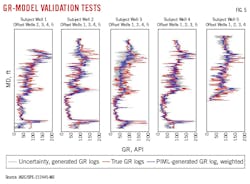
Fig. 5 shows results of leave-one-out validation tests rotating through each well as the subject well. Red solid lines are recorded GR logs from the wells. Blue solid lines are weighted GRs. The gray shaded regions are confidence intervals for GRs. GRs closely follows measured log trends. The table lists RMSE values for the unweighted vs. weighted GRs predictions compared with GRphy and GRemp estimates from the training set.
RMSE from the unweighted uncertainty is higher than weighted due to contributions from all formation classes in the weighted analysis. GRemp had high RMSE compared with GRphy and is not a suitable model to produce GR logs. It accurately captured, however, the relationship between drilling parameters.
GRphy accurately predicted measured offset GR logs due to high GR-log consistency among offset wells in the training set, but it failed to predict exact trends in areas of low correlation among the offsets. GRphy accuracy, therefore, depends on a set of offset wells that have internal consistency and are analogous to the subject well. Faults, low-angle paths, and high-angle noisy trajectories also negatively affect GRphy accuracy. These deficiencies can be addressed by incorporating trajectory-related information from the empirical model into a hybrid empirical physics model.
Based on “Cloud-Based Real-Time Well Engineering: Coupling Torque-And-Drag and Uncertainty Modeling,” IADC/SPE-212476-MS and “Real-Time Digital Log Generation from Drilling Parameters of Offset Wells Using Physics Informed Machine Learning,” IADC/SPE-212445-MS, presented at the IADC/SPE International Drilling Conference and Exhibition, Stavanger, Mar. 7-9, 2023.
About the Author
Alex Procyk
Upstream Editor
Alex Procyk is Upstream Editor at Oil & Gas Journal. He has also served as a principal technical professional at Halliburton and as a completion engineer at ConocoPhillips. He holds a BS in chemistry (1987) from Kent State University and a PhD in chemistry (1992) from Carnegie Mellon University. He is a member of the Society of Petroleum Engineers (SPE).


