Sharp eyes, interpretation needed to surmount checkshot data errors
William W. Gray
The author has encountered problems with checkshot data many times in a long career.
Checkshots are often accepted as a gold standard even after they are shown to be suspect. The cliché is, "Well data are hard data; it's the seismic that's got to be wrong."
Many explorers don't check the data, and not checking may cause them to pass up good prospects and sometimes create bad ones.
Errors are often obvious, but some can be subtle. Checkshot errors cause targeted horizons to be mispositioned in time, depth (either too high or too low), or surface location. In this article we present some errors as a "wake-up call" to those users who accept checkshots at face value.
Exposing discrepancies
The idea for this article became clear when the comparison of Velocity Databank's Original-Data Checkshot Library against original checkshot data revealed some significant differences.
When questioned about the differences between the datasets, VDB explained the processes its staff applied to find and correct data errors.
This led to a realization of the need to bring to the attention of all checkshot users that some of their original-check-shot data have problems. This article contains examples of errors found by VDB as well as problems that turned up in clients' offices.
Errors like those shown here should be documented and data corrections applied, but some problems are not so much errors as they are part of the original acquisition parameters and are subject to interpretation. In those cases, the individual interpreters must judge and modify data, as needed, for each project.
Well location
There are many different areas and opportunities for errors in checkshot data: design, acquisition, processing, and publishing.
Checkshot surveys are usually taken after all other logs have been run. After a long logging suite, logging crews are typically tired, and errors can creep into the work of fatigued people. Typographical errors on header information are common and usually easy to find and repair.
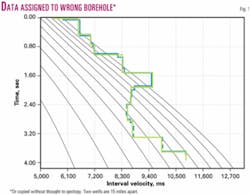
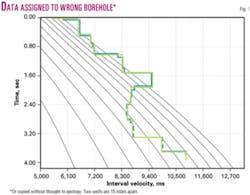
More significant errors are found in the data. Fig. 1 demonstrates the common error that occurs when a survey is copied to another location.
Here are two onshore wells, located 15 miles apart, loaded with the same checkshot survey. The wells are aligned perpendicular to geologic strike, and the regional dip is less than 1° between them.
The onset of pore pressure is ~500 ft deeper in the downdip borehole, based on resistivity measurements. The low velocity zone, at ~2 sec in Fig. 1, should have been ~100 milliseconds deeper in the downdip borehole.
Both of these wells' surveys were in the client's digital database as original surveys for the referenced boreholes. One of them is a time-sliced version of the other and has more data points than the original. This type of error is almost impossible to find and repair.
Workstation problems
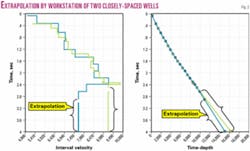
The example in Fig. 2 points up the single most significant problem when using a workstation to interpret time data with borehole log overlays: the extrapolation of borehole data below the deepest depth/time control.
Depending on the brand of workstation software being used, the workstation extrapolates below last known data using the last interval velocity from the depth/time function or, using a different brand workstation, data will not be extrapolated but rather truncated at the last depth/time pair.
Getting the best function for a well is not a trivial process. Time-to-depth functions where checkshots don't exist must be interpreted using geology, dip, and, shown in this case, a local undercompaction (pore-pressure) function. The depth/time function is then extrapolated below last known data using velocities from the interpretation and loaded at the borehole for which the interpretation was made.
Fig. 2 shows two closely located boreholes, each with a unique velocity survey. One survey was acquired slightly deeper than the other. If the older, not-as-deep (green) survey is used to interpret depth for a deeper prospect, the depth estimate to a seismic time horizon will be too deep by, in this example, over 1,200 ft at 4 sec or, stated another way, by 250 ms at 15,000 ft.
Also, if the older survey's data were used to post the newer (blue) log data, the tie at blue's TD would be too shallow by 10 ms or about 50 ft. This error occurs in every instance where the last interval velocity recorded in a borehole is not representative of the deeper rock velocities. There are different reasons for an interval velocity bust at the TD of a well: the sample rate might be too close, possibly a geophone depth error, or incorrect picking of the time value. Extrapolations can cause subtle errors, and interpreters almost never check for them.
The best way to ameliorate this problem is to use data that have been regionally interpreted and intelligently extrapolated below existing data using regional geology and geophysics, compaction rate functions, seismic velocities, and any other data that can be found.
Regionally interpreted data are always better than a blind extrapolation.1
Datum accuracy
Datum errors are not usually seen in offshore areas.
The datum for offshore wells is almost always sea level, although some offshore operators have caused their surveys to be datumed differently (sometimes as a subtle way to mislead competitors). A few surveys are datumed to mudline, and some are apparently set arbitrarily.
It is always wise to confirm the seismic datum and compare that to the checkshot's datum. Onshore the local datum can be trickier. Some borehole surveys of wells within rock-throwing distance of each other, correctly use datums with several hundred feet of difference. One survey of a well where the local ground elevation was 2,644 ft was datumed to sea level.
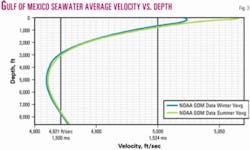
When changing datums, the correction velocity can be a source of error. Fig. 3 is the author's Gulf of Mexico Seawater Average Velocity Chart. This chart was calculated from published National Oceanic & Atmospheric Administration Gulf of Mexico water properties2 and a published seawater velocity formula.3
The point here is that the commonly used average velocity of 5,000 ft/sec for water is almost never correct. In relatively shallow water, the differences between the correct values and the commonly used 5,000 ft/sec are not material. However, problems are introduced when the interpreter removes and adds water layers as when using one survey to interpret depth/time functions for other locations with significantly different water depths.
Depth conversions using redatuming methods without very careful, thoughtful, and rigorous procedures can cause errors that can be large. When working with thick water layers, depth errors of greater than 100 ft are common and easily propagated throughout a survey or field study.
Deviated wells
Subtle errors are found in almost all checkshot surveys of deviated wells.
US law requires that offshore US continental shelf well data to be sent to the Minerals Management Service, but these records are not required to be accurate or correct. They contain typos, location errors, and other problems as described in this article.
Some older surveys in the MMS files (that many exploration companies acquire and use without checking) are assigned to the wrong borehole, have not been corrected for borehole deviation or properly corrected to datum, or cosine corrected for source offset and, occasionally, have time and/or depth inversions.
Some records in the MMS depth/time data are off by hundreds of feet and hundreds of milliseconds.
Velocity Databank's Checkshot Library contains numerous examples of data and location errors they have corrected in records acquired from the MMS. In fact, the MMS files contain so many errors that VDB no longer accepts digital data sourced from the MMS.
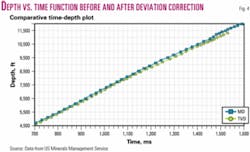
Fig. 4 depicts the differences between the original calculation and after applying the deviation survey, showing how the MMS sourced data are ~600 ft and ~60 ms deeper than the corrected version.
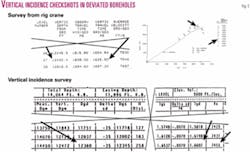
It is important that Vertical Incidence checkshots be acquired in deviated boreholes. The 300 ft of depth difference (at constant time) between two surveys shows clearly when the two surveys (Fig. 5) are compared graphically on the right side of Fig. 6.
The survey at the upper left quarter of Fig. 5 was acquired with shots taken from the drilling platform and cosine corrected for the deviation. The survey at the right and bottom of Fig. 5 was taken after the well was deepened, and is a Vertical Incidence survey. A boat was located over the borehole as diagrammed at the upper right of Fig. 5.
There is an overlap zone where the two surveys are tied together, but since there were no shots at common levels, there is no "absolute" tie. The use of a simple cosine correction function to vertically correct the offset time for the "rig acquired" (magenta) portion of the deviated survey is not adequate to make a good depth conversion.
Commonly, anisotropy is touted as the reason for the difference. It is true that in the GOM, shale has horizontal velocities that are somewhat faster than the vertical velocities and deviated well surveys have a horizontal component but, shown in the model described below, this excuse needs some work.
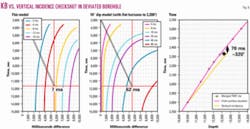
The left two graphs in Fig. 6 show results from some model calculations made based on the previous deviated well survey. The model doesn't contain any anisotropy components. It was calculated from parallel layers using only geometry and simple raytracing.4
Note the large differences in the borehole data shown on the right side of Fig. 6. Part of the 70-ms difference between the vertical incidence and "from platform" checkshot might be attributed to anisotropy, but as demonstrated by the 10° dip model in the center of Fig. 6, there can be depth/time differences, with the magnitude observed, only because the beds are dipping. The "red cross hair" is at the same offset and depth as the base of the overlap of the two checkshot surveys.
The lesson here is that deviated wells should always have Vertical Incidence checkshots if they are expected to reasonably tie seismic data.
We also know from experience that dipping seismic horizons are usually horizontally mispositioned, to a greater or lesser degree, by the seismic migration process, and even prestack-depth-migrated dipping horizons will mistie a vertical incidence checkshot. The checkshot's (or synthetic seismogram's) ties will usually appear to be shallower than the dipping seismic time horizon. This same raytrace/geometry problem occurs if the source offset is "large" as in Far Offset VSP data and in processed seismic data.
Data from "imaging" type velocity measurements can't be used for accurate depth conversion and should be used only when the image sourced data have been calibrated to borehole data. If no other data are available, the depth conversion from seismic velocities can be made but will not be accurate. This caveat also includes prestack depth migration velocities.
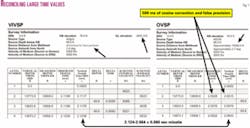
Large time values have to be reconciled between Far Offset VSPs and Vertical Incidence VSPs (Fig. 7). The OVSP (right side of Fig. 7) has almost 500 ms of cosine correction applied. Comparing the OVSP and the VIVSP at the same depth in the borehole shows that even after 500 ms of cosine correction the OVSP still misties the VIVSP by 60 ms. We can assume, based on the model data shown in Fig. 6, that these OVSP data might contain dip and anisotropy complications.
The energy source
The interpreter must take into account the type of energy source used.
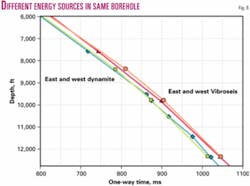
Two checkshot surveys were acquired at the same levels in the same borehole using different energy sources (Fig. 8). One of the surveys was shot with dynamite and the other was acquired using a Vibroseis source. The offset parameters were similar for each survey, and shots were taken from both sides of the borehole for each survey.
The bottom line here is that there is a 24 ms one-way-time (47 ms two-way-time) difference in the observer's time picks, at the same levels, between the dynamite and Vibroseis sources using the same parameters for each survey. It is clear from this example that surveys with different sources shouldn't tie and may not consistently tie local seismic. A corollary thought suggests that borehole surveys should be acquired using the same source type that was used to acquire the seismic.
Upshot for explorers
Because of the numerous opportunities for errors in checkshot data, explorers absolutely must know:
- The origin of the survey.
- The type of survey.
- The well location.
- The energy source used.
- The datum.
- The datum corrections.
- The borehole deviation.
- The source offset.
- The source adjustments and corrections.
- The manner the survey was loaded into the workstation.
- How the workstation handles borehole data and how it extrapolates.
A little reading and a few simple calculations might save or make a prospect. A check of the borehole and checkshot acquisition geometry might reveal or solve problems with an interpretation. This note covers only the most common of the many errors that find their way into checkshots. Checkshots, like other data, do require some interpretation.
Acknowledgments
Thanks to Tom Pelatari of Velocity Databank for permission to use material from his library of original checkshot data and for help in finding examples for this article. Thanks to Lynn Coyle and Michael Keaveney for suggestions and help with proofreading.
References
- Gray, William W., Rock, J., and Desler, J., "Creation of a Velocity Data Base in the Offshore Gulf of Mexico," Expanded Abstracts, SEG Annual Meeting, Dallas, 1989, pp. 864-866.
- NOAA Atlas NESDIS 46 World Ocean Database 2001, NOAA-NESDIS-National Oceanographic Data Center, 1315 East-West Hwy., Silver Spring, MD 20910-3282 (http://www.nodc.noaa.gov).
- "Acoustics Technical Guides–Speed of Sound in Sea-Water," Underwater Acoustics, National Physical Laboratory, Teddington, Middlesex, UK, TW11 0LW (http://www.npl.co.uk/acoustics/techguides/soundseawater).
- Sheriff, R.E., and Geldart, L.P., "Exploration Seismology," 2nd ed., Cambridge University Press, New York, 1995.
The author
William W. Gray (w.gray @excite.com) is a consultant with 30 years' experience in hydrocarbon exploration. He has worked for Superior Oil Co., Transco, Sohio, TGS, and IGC and has consulted for numerous other companies. His area of expertise is the detailed interpretation and correlation of seismic, reservoir, and borehole data. He is currently interpreting seismic time data and borehole depth data to create built-for-purpose interpolated and extrapolated velocity volumes. He has a BS in geology from the University of Houston.
