Integrated Marcellus model accesses natural fractures
Based on “Innovative Modeling to Quantify the Impact of Natural Fractures, Optimize Well Spacing and Increase Productivity in the Marcellus Shale,” URTeC 5271, Unconventional Resources Technology Conference, Houston, Jul. 26-28, 2021.
Chief Oil and Gas LLC and collaborators performed a field recovery study to address outstanding questions regarding Upper and Lower Marcellus properties. A field model integrating natural fractures into coupled 3D geomechanical, unconventional fracture (UFM), and 3D dynamic dual-porosity models addressed performance variation between wells, underperformance of child wells relative to parent wells, optimal lateral spacing and length, role of open tectonic natural fractures in stimulation and production, and whether hydraulic fracture geometries are correlated to pumping volumes.
Results of the study indicate that pressure depletion and well spacing in the Marcellus depend on open tectonic natural fracture networks. The models show overall increased recovery when wells couple to a discrete natural fracture network (DFN). Individual well recovery drops rapidly with increased well density when connected to far-field fracture networks. Wells in fields without DFN experience little interwell interference until a threshold is reached. Optimized well spacing therefore depends on accurately modeling DFN.
Infill modeling study
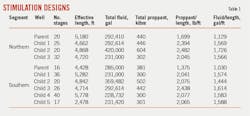
Within the 31-sq-mile study area, a 3-sq mile flow simulation area was chosen to understand completion-production correlations among 10 horizontal wells in the basal Marcellus interval (Hot Marcellus). The area contains north and south segments separated by a non-producing fault block. Parent wells were completed and initially produced in 2013-14 with 2,400-5,800 ft lateral lengths. Child wells were drilled and completed 2.5 years after parent well production. Child wells were spaced equally at 1,100 ft in the northern segment and varied in spacing from 750 ft to 2,000 ft in the southern segment (Table 1).
Northern parent-well production exceeded child-well production even though child wells were completed with larger fluid and proppant volumes. By contrast, southern child wells produced as much or more than their parent well.
A model was constructed to understand this behavior, integrating geology, geomechanics, natural fractures, completion design, and reservoir analysis by:
- Integrating log, core, and 3D seismic data within a 3D earth model.
- Generating a DFN model for natural fracture intensity, geometries, and geomechanics.
- Building a hydraulic fracture model combining DFN and hydraulic fracture completion details.
- Creating a history-matched reservoir flow model within the representative 3D earth model, updating stress field states caused by pressure and volume depletion.
The model generates forecasts using variable lateral spacing and determines the most cost-effective development strategies for the remaining acreage.
Static geological model
A static geological model described porosity, permeability, water saturation, minerology, and lithofacies within the study area. A dual-porosity model for the 10 existing horizontal wells was created from a 3-sq mile extract of the static geological model. Wireline logs, calibrated to core, provided porosity, water saturation, and permeability curves. Elemental log analysis determined that porosity in the Marcellus was 7-8%, about 40% lower than previously reported density-log value estimates.
Five distinct rock classes were identified using heterogeneous rock-type analysis (HRA) combining gamma ray, density, and neutron-porosity logs. Classes ranged from shale to siltstones and limestones with varying organic- and fluid-storage content. Class 1 (organic shaley siltstone) and Class 3 (organic limy siltstone) were the most hydrocarbon intensive classes. The classifications produce a seismic lithocube (lithoclassification and litho-probability volumes within the 3D area of interest) using probability density functions (PDFs) based on relationships between the classes and acoustic impedance and bulk density.
A facies model combined well-based HRA classification with the lithocube to determine matrix total and effective porosity, matrix permeability, water saturation, volume of clay, and total organic content around key wells. The results indicated that the petrophysical properties were consistent among wells and not a driver of the observed differences in production performance.
Geomechanical modeling
Rock stresses and pore pressures were determined by 1D and 3D modeling studies. A 1D mechanical earth model (MEM) calibrated rock properties, pressure, and stress profiles against triaxle core tests, diagnostic fracture initiation tests (DFIT), and axial, radial, and azimuthal sonic measurements.
DFITs yielded pore pressure gradients with positive correlations to average kerogen volume determined from petrophysical evaluations, suggesting overpressure is directly related to organic content and hydrocarbon thermal maturation in the Marcellus. Pore pressure gradients derived from the 1D modeling study, therefore, can be distributed using the kerogen volume property model to create a 3D pore pressure model. The minimum horizontal stress is calculated by combining elastic properties and pore pressure distribution. The determined maximum horizontal stress is 3-7% greater than the minimum horizontal stress and is consistent with historic drilling experiences and shear-wave acoustic velocities. The resulting 3D MEM provided input for hydraulic fracturing modeling.
Natural fractures
A discrete fracture network (DFN) model captured density, geometry, and orientation of natural fractures to determine effects of these fractures on hydraulic fracture geometry and far-field drainage capacity of the reservoir. DFN consists of J1 and J2 regional fracture sets. Fractures for set J1 are roughly aligned with the present-day horizontal stress azimuth, striking around N75E, whereas J2 is North-South oriented.
The DFN model was constructed with three seismic attributes:
- Seismic anisotropy azimuth. Azimuthal anisotropy is used to indicate dominate fracture regions between J1 and J2.
- Seismic velocity anisotropy. Velocity anisotropy reveals degree of polarization and arises from increasing fracture intensity and openness in the dominant set (whether J1 or J2).
- Ant track volume. Ant-tracking only captures continuous features containing fault shapes. Anisotropy anomalies coinciding with ant track discontinuities are considered tectonically driven features likely to contain J1 and J2 sets.
Intensity models for the J1 and J2 sets were derived from seismic velocity anisotropy attributes after filtering through seismic anisotropy azimuth attributes. For the J1 set, areas of low-velocity anisotropy were given a 50-ft fracture spacing, linearly decreasing to 35 ft with increasing velocity anisotropy. The J2 set was given a 75-ft fracture spacing, linearly decreasing to 33 ft with increasing velocity anisotropy.
Ant track anomalies define tightly spaced and open tectonic natural fractures. Velocity anisotropy anomalies aligned with boundaries of these features help confirm the interpretation of tectonically derived fractures. J1 and J2 sets were revised to match the interpreted intensity and fracture openness in these areas.
Hydraulic fracture modeling
UFM aided fracture propagation and well interference studies. UFM propagates fractures and elastic deformation within the surrounding rock and fluid flow in the fracture network through a fully coupled system that includes fracture geometry, fluid rheology, mass conservation, and leak-off.
UFM is constructed using DFN and 3D MEM model fractures and pumping schedules from fracture treatments. Hydraulic fracture geometry calibration came from three representative stages per well based on post-treatment instantaneous shut-in pressures (ISIPs) using leak-off and frictional pressure drops as tuning parameters. The calibrated UFM was run for the full wellbore with results validated by production history match.
Table 1 includes stimulation details of all parent and child wells. For parent wells, modeling used initial stresses and pore pressures. The model was calibrated to treatment data and verified with production history using a dual-porosity reservoir model.
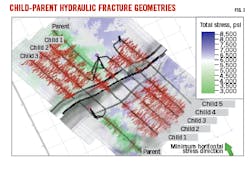
For child wells, stresses were altered in the UFM due to parent well depletion. Depleted pressure distributions from parent production were modeled by a 3D finite-element geomechanical simulator. The resulting spatial and temporal changes in stress magnitude and azimuth from parent to child resulted in the model hydraulic fracture geometries in the perturbed stress field in Fig. 1. Lower stress values are shown in green around the parent wells, reflecting the later changes in stress field after parent depletion.
Dual porosity reservoir model
A 3D dynamic dual-porosity multi-well simulation model integrated geologic and geomechanical information with hydraulic fracture properties. The southeast corner of the geological model was simulated covering 3 sq. miles, with a 20 × 20 × 120-ft grid size. Faults and matrix properties (porosity, permeability, and water saturation) were included in the model. Hydraulic fracture geometries and conductivities were converted from the fracture simulation model to the reservoir simulation model.
The dual porosity model uses fluid flow only from the fracture network, with the reservoir matrix serving only as a source. Reservoir shape (sigma) factor, used to determine matrix and fracture interface area per unit volume, was determined by the methods of Warren and Root and Kazemi et al.1-2 System permeability combined matrix permeability from the geological model, hydraulic fracture permeability from the hydraulic fracture simulation, and natural fracture permeability used as a history matching parameter.
Calibration, matching
Open tectonic natural fractures, DFN permeability, and sigma factors were adjusted for production and pressure history matches. DFN was subdivided by creating open and closed tectonic natural fracture sets. Open DFN had enhanced porosity and permeability. One set (open-DFN Set 1) was open a given distance away from ant track anomalies and represents high-permeability zones associated with large faults and fracture swarms of tectonic origin. This set, however, contributes little to production. Another set (open-DFN Set 2) was identified in which seismic velocity anisotropy exceeds 2%.
The open tectonic natural fracture sets were input to the reservoir simulation model and converted into dual-porosity simulation properties. Enhanced permeability was used for calibration with highest permeability in faults, moderate permeability in open-DFN Set 1 fractures, and lowest permeability in open-DFN Set 2 fractures.
History-match exercises showed the best match when both open-DFN Set 1 and 2 fractures were flow conduits but not effectively connected to the matrix due to mineralization. When accessed from the fracture treatment, open DFN sources provide early pressure support. The mineralized surface, however, limits connection to the matrix and provides little long-term pressure support. This is modelled by reducing the sigma factor. Gas stored in the matrix drains through hydraulic fractures for long-term pressure support.
Stress perturbation and fracture geometry of infill child wells were determined in the geomechanical mode by using the history-matched dual porosity model with 2016 pressure distribution containing only parent wells.
Model results
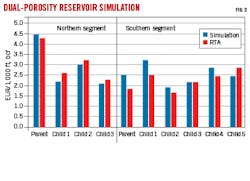
The production forecast was run for 30 years with bottom-hole pressure control. Fig. 2 shows EUR/1,000-ft lateral/well predictions between the simulation model and rate transient analysis (RTA) models. The north parent well’s EUR is higher over both the southern segment parent and northern child wells due to its access to extensive open DFN area. The model showed that pressure depletes further into the undrilled eastern drilling units of the northern section through open DFNs.
An infill well was planned between the southern parent well and the adjacent child well, but the model showed that pressure depletion from existing producers would result in minor EUR, and the well plan was abandoned. In late 2019, two 12,000-ft wells were drilled east of the northern-section parent well with 1,700-1,800 ft spacing from both the parent and each other based on offset performance and optimized simulation analysis. The infill well closest to the parent had an initial rate of 30 MMscfd and the infill furthest from the parent had an initial rate of 36 MMscfd, reflecting the effects of the pressure depletion field. EUR/1,000 ft are estimated in the 3.2 to 3.5 bcf/1,000 ft range combined, given parent and child well performance in the northern section.
Parent wells effectively drain the near wellbore region through the hydraulic fracture network and far-field from open tectonic natural fracture sets, resulting in both high recovery of parent wells and limited pressure support for child wells, regardless of superior child well completion factors (Table 2, Fig. 3). The open DFN sets drive the parent well drainage volume, and the northern parent well drains a relatively larger area than the southern parent through a more extensive open fracture system. Northern child wells, therefore, produce relatively less than their parent than southern child wells.
The 3D finite-element geomechanical simulator predicts minimum horizontal stress reduction up to 2,000 psi from depletion in the northern segment, increasing horizontal stress anisotropy by up to 20% and reorienting stress away from the initial 68° maximum horizontal stress azimuth. These perturbations affect child-well hydraulic fracture propagation and lead to fracture hits and reduced height growth. Hits are more common in the northern section due to tighter well spacing, more pronounced depletion, greater stress perturbation, and more closely spaced and extensive DFN.
The combination of stress changes affecting the fracture treatments and depletion of far field open tectonic natural fractures in the northern section results in child-well production significantly less than the parent. The southern segment does not suffer as much and child wells have on average the same production as the parent, albeit with more intensive fracture treatments and higher fracture density.
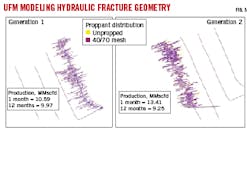
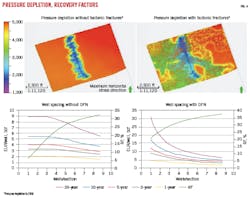
Results of the study indicate that pressure depletion and well spacing in the Marcellus depend on open tectonic natural fracture networks. Fig. 4 shows the pressure depletion map (out to 2050) and recovery for 35 years of a modeled area based on well spacing with and without open tectonic fracture networks available. The models show overall increased recovery factor with DFN. Without DFN, pressure drainage area is driven by the stimulated reservoir volume. With DFN, wells can drain a larger area, increasing recovery.
Well spacing varies depending upon DFN. With DFN individual well recovery drops rapidly with increased well density reflecting connected far-field networks. Wells in fields without DFN experience little interwell interference until a threshold is reached.
References
- Warren, J.E. and Root, P.J., “The Behavior of Naturally Fractured Reservoirs,” SPE-426-PA, SPE Journal, Vol. 3, No. 3, Sept. 1, 1963, pp. 245–255.
- Kazemi, H., Merrill, L.S., Porterfield, K.L., and Zeman, P.R., “Numerical Simulation of Water-Oil Flow in Naturally Fractured Reservoirs,” SPE-5719-PA, SPE Journal, Vol. 16, No. 6, Dec. 1, 1976, pp. 317–326.
About the Author
Alex Procyk
Upstream Editor
Alex Procyk is Upstream Editor at Oil & Gas Journal. He has also served as a principal technical professional at Halliburton and as a completion engineer at ConocoPhillips. He holds a BS in chemistry (1987) from Kent State University and a PhD in chemistry (1992) from Carnegie Mellon University. He is a member of the Society of Petroleum Engineers (SPE).
