Water time-lapse geochemistry reveals subsurface allocation
Produced water from fracture flowback is initially composed mostly of stimulation water, but over time evolves to larger percentages of subsurface brines with unique chemical signatures. Time-lapse geochemistry (TLG) measures the proportion of frac water in the production and identifies contributing zones by using detailed chemical analyses on water samples over time. TLG offers insights into reservoir drainage, production allocation, and changes in contributing rock volume (CRV).
Several recent studies on TLG were presented at the Unconventional Resources Technology Conference (URTeC) held July 26-28, 2021. This article highlights two studies which demonstrate how produced water aides in asset management.
Source tracking
Chevron determined vertical-horizontal heterogeneity in unconventional reservoirs from TLG in the Permian basin.1 Specific ionic strengths and relative chemical ratios correlated to specific formation areas based on extensive produced water sampling. Analysis of produced water determined frac water content and tracked water sources over time.
Water chemistry data were collected at the wellhead from 133 horizontal wells at five different geographic areas in the basin. Completion zones are in the same formation but at different depths for all wells. Samples were analyzed for chloride (Cl-), calcium (Ca+2), barium (Ba+2), magnesium (Mg+2), bicarbonate (HCO3-), sulfate (SO4-2), and dissolved hydrogen sulfide (H2S) concentrations.
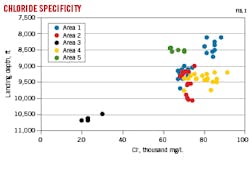
Although all samples are from the same formation, ion concentrations vary significantly with landing depth and location. For example, Area 3 wells have lower salinity and divalent cation concentrations than water from other wells. Fig. 1 shows somewhat negative overall correlation between chloride concentrations and landing depth for all areas, but little correlation within each area. Calcium and Ba+2 also trend negatively with depth but are not as strongly correlated. Bicarbonate and SO4-2 correlations are slightly positive overall with depth but again, with little correlation within an area.
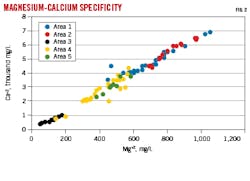
Correlations between different ions in produced water provide greater specificity. Fig. 2 shows strong linear correlation between Ca+2 and Mg+2. The Ca+2-Mg+2 ratio is controlled by diagenesis, and strong linear correlation is expected in the targeted formation. The correlations are similar between Areas 1 and 2, and between Areas 4 and 5. The two groups, however, are differentiated from each other. Area 3 ionic strength is distinct from the other areas.
Conversely, correlation between Na+ and K+ concentrations does not yield an overall linear relationship for the field, but individual areas have their own relationships. The relationship between the two ions is through equilibrium with Na-feldspar and K-feldspar and the different linear correlations of the relationship between the areas may result from feldspar heterogeneity in the formation.
Relationships were also derived between Ba+2 and SO4-2, and Ca+ and HCO3- (not shown). The relationships yielded similar results to the other ionic analysis: trending relationships with some specificity to source based on ionic strength.
H2S was not deemed a useful parameter for source identification. There was some differentiation between areas based on H2S concentration. Areas 1 and 2 had less than 0.5 mg/l. H2S and Areas 3-5 had H2S higher than 0.5 mg/l, but there were no clear reasons for these differences that could be tied back to specific geochemistry in each zone. There was no universal correlation between H2S concentration and total dissolved solids (TDS) or SO4-2.
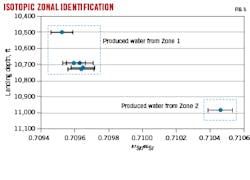
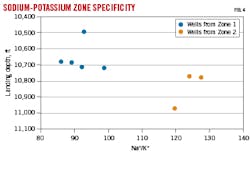
Fig. 3 shows strontium (Sr) isotopic ratios with landing depth. Significant differences are observed between formation Zone 1 and Zone 2. Likewise, the Na+-K+ ratio is significantly different between Zones 1 and 2 (Fig. 4).
Combining these chemical relationships with ionic strength in produced water samples yields insights into production sources and field development.
Performance analysis
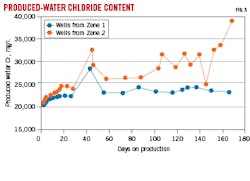
A field case study was performed in which Well B produced significantly more water than adjacent Well A. Landing zones, however, were in the same formation. Derived produced water signatures were used to identify production sources. Fig. 5 shows produced Cl- concentrations over time for the two wells. Although Cl- ionic strength began at similar levels, Cl- in Well B increased over Well A starting at about 40 days and greatly increased at about 170 days. Data from Ca+2-Mg+2 ratios showed similar results (not shown). The results indicate that water sources are different between the two wells, and Well B is assumed to have tapped into external water from natural fractures.
Fracture surveillance
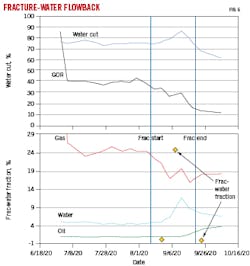
Produced water chemistry was used to monitor fracture-driven interactions between parent and child wells. Fig. 6 shows changes in water production, GOR, and oil production of a parent well during a fracture treatment of an infill well. Using geochemical tracer analysis on parent produced water samples, the fraction of water associated with the fracture treatment increased to about 25% of the produced water in the parent during the middle of the job, but quickly subsided back to trace amounts after the treatment was finished. The data show that communication was established between the two wells. The parent experienced a rise in oil production during the job, possibly due to connected fractures indicated by the produced water data.
Water source allocation
Deconvolution of produced water into component sources is critical for production allocation and understanding key factors that affect well performance such as frac growth and stimulated reservoir volume (SRV). In a study of Powder River basin by Devon Energy and Auburn University, a novel method was developed to determine proportion of returned fracture treatment water and contributing zones in produced water samples.2
Powder River basin is in northeastern and southeastern Wyoming and contains stacked unconventional pay targets in the Upper Cretaceous sediments which include tight siliclastics (Turner formation) and argillaceaous chalk-marls (Niobrara formation). The Turner sandstone is about 180 ft thick and is subdivided into Upper and Lower Turner intervals with significantly different lithofacies. A shale break (Sage Breaks member of the Carlile formation) overlies the Turner and is about 100 ft thick in the study area, providing an important barrier between Upper Niobrara and underlying Turner wells. The break thickness is variable throughout the basin due to erosional unconformity. Volcanic ash beds (bentonites) are commonly observed in cores below the base of the middle Niobrara chalk (“B” chalk) which minimize downward growth of hydraulic fractures from the Niobrara.
Determining water sources from produced water samples can be difficult or impossible in well-connected highly fractured or porous systems where fluid flow can occur over hundreds of kilometers. Many unconventional reservoirs, however, have immobile fluids with a dominant component of capillary-bound water. Solute transport and water movement in these layers are more limited, providing an opportunity to identify sources from produced water samples.
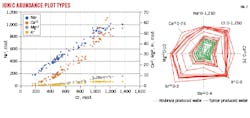
A simple plot of ion concentrations for 100 Turner and Niobrara well-produced water samples, however, shows little specificity that can aid the deconvolution (Fig. 7, left). Although Turner wells typically have higher salinity than Niobrara wells, the plots yield simple linear relationships between Cl- and cation ion concentrations. Plotting ion concentrations in a radar plot reveals differences between Turner and Niobrara wells in terms of ionic strength, with Turner produced water having higher ionic concentrations than Niobrara produced water (Fig. 7, right). The radar plots yield shapes that identify and quantify water sources in the produced water samples.
A genetic origin and alternation tool (GOAT) discriminates formation water sources from different subsurface zones using isotopic data. GOAT uses radar plots with axes composed of isotopic ratios that track common changes in water diagenesis. This technique does not use genetic sequencing from downhole bacteria. The name refers to chemical compositions as identifiers for source water origin.
If formation water associated with hydrocarbon zones experiences little fluid flow, diagenesis occurs from lithology differences and corresponding mineral-water reactions over time. It is sensitive to depth and temperature. Water evolves through three main reactions which alter cations in subsurface brine: dolomitization (consuming magnesium and producing calcium), albitization (consuming sodium and producing calcium), and illite-smectite transformation (consuming potassium and producing sodium, calcium, iron, and water). Using these mechanisms, an extensive set of chemical ratio parameters were developed for Powder River basin based on salinity source, lithology related effects, and temperature-maturity effects to identify source water in produced water samples.
Four samples represent water chemistry from Middle-Lower Turner, Upper Turner, Niobrara shale-marl, and Niobrara B chalk reservoirs. Radar plots use axes representing diagenetic compositions from water evolution (EV), geothermometers (GT), lithology (Lith), salinity source (SS), and organic matter (OM).
Water evolution is primarily driven by transition from NaCl to a mixture with CaCl2 and the Na+-Ca+2 ratio decreases over the course of diagenesis. Bicarbonate is another reservoir-specific identifier because it is subsurface unstable and decreases rapidly with depth and temperature.
Lithology sources are identified primarily by silicon, which is high for tightly shaley or siliceous units and low in waters that have higher TDS from typical evolutionary (water-aging) processes. Salinity source parameters use ratios that highlight differences related to composition of evaporites that were the source of salinity. These are differentiated by relative abundances of potassium, calcium, magnesium, strontium, and barium.
Organic matter identification is through ratios of boron (B+3) to other species. Boron comes from leaching of minerals and organic matter. Elevated B+3 levels, therefore, occur in source rocks or hydrocarbon-bearing zones. Boron levels, when related to organic matter degradation, increase with thermal maturity, and B+3 ratios differentiate organic rich from organic-poor siliciclastic lithofacies.
Analysis of produced water using this method requires baseline fluid samples from producing wells completed in zones targeted by stimulation. Frac water samples are also required. A GOAT radar diagram is customized for the area of interest from the baseline samples. Each axis is unitized to display percent deviation between sample values, providing a visual map and a similarity index based on average deviation of all parameters.
Relative contribution of frac water to formation water is usually assessed through crossplot of relative oxygen (O-2) and hydrogen (H+) isotope abundance. For Powder River basin, fracturing water comes from surface sources and has large isotopic contrast from subsurface brine, indicating that there are only two types of water mixing. Additional information on other water sources is obtained through oxygen isotopic ratio comparisons to TDS or Cl- concentration.
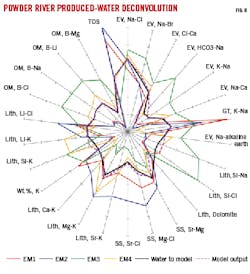
The GOAT water unmixing program typically uses between three and five endmember (EM) water compositions. Powder River basin analysis used the four reservoir EM samples described above and added a frac water EM sample. Radar plots of EM samples (Fig. 8) show that Middle-Lower Turner has higher lithium (Li+2) and lower K+ than Upper Turner, and higher relative Sr, Mg+2, Ca+2, and Li+2 than Niobrara shale-marl. The Niobrara shale-marl is distinct with low Sr, Mg+2, and Ca+2, yet contains high Si, K+, and B+3. Niobrara B chalk has lower water evolution relative to Turner samples (higher Na+ relative to Ca+2 in the northeast EV quadrant of the chart). Niobrara shale-marl has the highest Na+-Ca+2 ratios of all EM samples.
Water samples are deconvoluted by varying volume percent of EM members to match produced water samples. The program uses estimated values for total salinity to normalize relative abundance of various ions for each sample and correctly weight each EM sample. The solution is calculated per Equation 1.
All radar plot parameters are calculated from each ion concentration in the solution, and the difference between the modeled trial solution and specific produced water sample is determined from root mean square (RMS) analysis. The percent of each endmember is then varied through iteration until RMS is minimized.
Fig. 8 shows results of matching mixtures of the four Power River EM samples and frac water to produced water from a Niobrara B chalk targeted well (D-1XNH). The accompanying table shows estimated salinity of the formation water, salinity of the water being modeled, salinity of the modeled solution, and volume percent for each EM sample to produce the match.
The produced water does not match any single EM sample. After iteration, RMS deviation between the calculated mixture and produced water sample was 1.68%. This is graphically illustrated by the calculated (dashed) line pattern on Fig. 8 which closely follows the sample (black) line pattern. The sample contained 44% Niobrara B chalk water, 19% Niobrara shale-marl water, 14% Middle-Lower Turner, 23% frac water, and no Upper Turner water.
Time-lapsed produced water analysis indicated that the contributing rock volume is dominated by the target zone, but the quantity of Middle-Lower Turner water suggests that the stimulated rock volume extended into the Turner formation.
References
- Wang, W., Wei, W., Saneifar, M., Liang, B., Parizek, J., Nguyen, H., Menconi, M., Yang, F., Khalili, C., “Produced Water Chemistry Surveillance and Application in the Permian Basin,” URTeC 5321, Unconventional Resources Technology Conference, Houston, July 26-28, 2021.
- Jones, P., Dressler, D., Connor, T., O’Brien, J., Klaassen, and Bingham, S., “A Novel approach to Understanding Multi-Horizon Fluid Flow in Unconventional Wells Using Produced Water Time-Lapse Geochemistry: Powder River Basin, Wyoming,” URTeC 5993, Unconventional Resources Technology Conference, Houston, July 26-28, 2021.
About the Author
Alex Procyk
Upstream Editor
Alex Procyk is Upstream Editor at Oil & Gas Journal. He has also served as a principal technical professional at Halliburton and as a completion engineer at ConocoPhillips. He holds a BS in chemistry (1987) from Kent State University and a PhD in chemistry (1992) from Carnegie Mellon University. He is a member of the Society of Petroleum Engineers (SPE).
