Wolfcamp HFTS study reveals complex reservoir behavior
An integrated approach involving production analysis as well as hydraulic and natural fracture diagnostics offers new insight into reservoir volumes drained by Wolfcamp wells at the hydraulic fracture test site (HFTS) in Permian basin. Drained rock volume was modeled for two wells, one in Upper Wolfcamp (UW) and one in Middle Wolfcamp (MW). Recovery factors indicate that hydrocarbon volumes connected by hydraulic fracture (HF) treatments are lower than original oil in place (OOIP) regions between the wells, and infill wells may recover stranded oil.
Wolfcamp HFTS
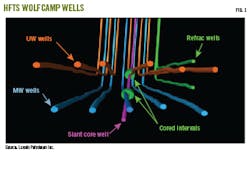
Wolfcamp HFTS has 13 horizontal wells, all drilled from four well pads in a southerly direction near the northern boundary of two lease sections. UW and MW benches were developed with 2-mile (~10,000 ft) laterals. Average horizontal well spacing was 660 ft with six wells drilled into UW and five wells drilled into MW. A centrally placed slanted slim-hole well provided cores, pressure measurements during well interference tests, and micro-seismic monitoring during fracture treatments. Fig. 1 shows gun barrel views of the wells.
Completing wells as zipper fractures minimized stress shadowing effects. Fig. 2 shows the zipper sequence. The outer eastern well pair were initially completed in 2015 and refractured and repressurized before the zipper fracture jobs to avoid boundary effects related to pressure depletion in these early wells.
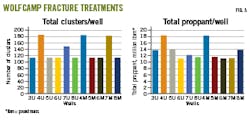
Fracturing occured in multiple stages with three to five clusters per stage. Spacing was 53-90 ft, and proppant loading was 1,100-1,800 pounds-mass (lbm)/ft, depending on the well (Table 1). Fig. 3 shows total number of clusters and total proppant per well.
OOIP is estimated at 72 million bbl/section in UW and 69 million bbl/section in MW (each section is 1 sq mile or 640 acres), translating into 24 million bbl/well in UW and 27.5 million bbl/well in MW. Given the 2-mile lateral length, effective spacing is 213 acres/lateral in UW and 256 acres/lateral in MW.
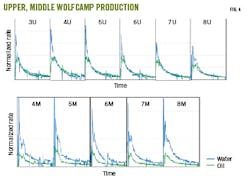
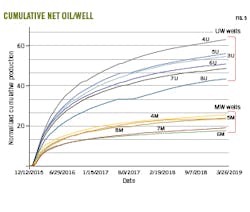
All wells started producing in late 2015. Fig. 4 shows relative oil and water rates for UW and MW wells during the first year of production. Total rates (oil, water) between UW and MW wells were initially about the same, but water-oil ratio (WOR) was about three times higher for MW wells than UW wells, resulitng in higher UW total production after about 200 days. Much early water production can be attributed to frac water flowback, but near the end of the year WOR in MW was still about double that in UW, indicating that lower wells were accessing connate water or other water sources. The high water cut results in significantly less net oil from MW wells than UW wells (Fig. 5).
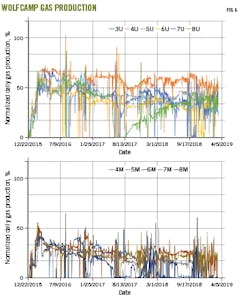
UW produces more associated gas than MW. Gas rates and gas-oil ratio (GOR) generally do not decline with oil rate decline because well pressures drop below bubble point (BP). The effect is more pronounced in UW than MW. Fig. 6 shows stabilized and increasing gas rates for UW wells and stabilized or decreasing gas rates for MW wells.
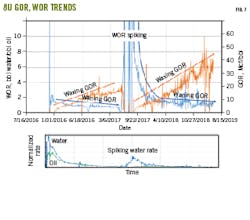
Fig. 7 illustrates how expanding gas reduces water cut for 8U in UW. As the well declines below BP, expanding gas (waxing GOR) reduces water production (waning WOR). The water is not simply depleting; shut in of the well resulted in spiked water rates after the well came back online (Fig. 7, lower graph). During the 2-month shut in, reservoir pressure increased above BP, resulting in gas going back into solution, allowing water to produce. Once flow was re-established, near wellbore pressure dropped below BP and gas breakout reestablished the waxing GOR, waning WOR pattern.
Decline curve analysis
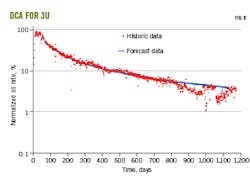
Production continued for more than 3 years before decline curve analysis (DCA). Fig. 8 shows normalized oil rates for 3U starting at the third month of production. Harmonic analysis determined well flow regimes.
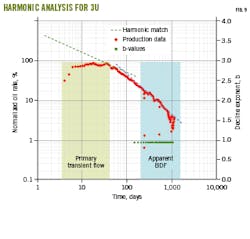
For Wolfcamp wells, three flow regimes typically occur within the first 1,000 days of production. Primary transient flow starts immediately and transitions within 200 days to apparent boundary dominated flow (BDF) when pressure transients of adjacent hydraulic fractures meet. This regime is characterized by harmonic exponent b = 1.
Secondary transient flow, when pressure fronts from HF tips propagate through drainage volume but do not interfere with drainage zones of adjacent wells, typically starts in 40-200 days. For this regime, exponents tend to range from b = 1 to b = 1.8. True boundary dominated flow, when adjacent wells are in pressure communication, is characterized by b = 0.5 and typically starts after 350 days.
Stable b-values are difficult if not impossible to observe from noise in production data. Clear b-value patterns emerge, however, when decline curves are history matched through reservoir simulation with b-values calculated from matched curves. Fig. 9 shows log rate-log time DCA based on reservoir simulation of 3U production data. Decline rate is 3.42%/yr and b = 0.94, close to the b = 1.0 harmonic expected for apparent BDF. This indicates that the well has transitioned from primary transient flow to apparent BDF without entering true BDF.
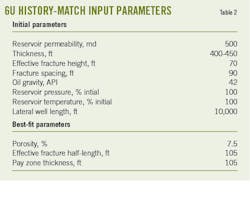
To observe true BDF behavior, well 6U was chosen for late-time analysis by history matching with a commercial reservoir simulator. Table 2 lists non-unique history-matched simulation parameters based on measured rate and bottom hole pressure (BHP).
Although UW formation thickness is 400 ft, the initial guess at effective fracture height was only 70 ft, based on previous studies. Actual net height is uncertain. Effective net height is sensitive to OOIP in the simulator, and initial simulations with 400-ft net height and full reported OOIP produced a poor late-time match. A suitable match occurred with 105-ft net height. Either upward fracture growth terminated early due to formation layering, OOIP was much lower than estimated, or a combination of both.
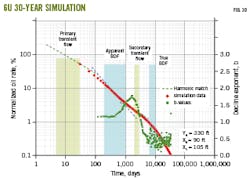
After determining all reservoir properties through history matching, continuous production was simulated for 30 years based on parameters in Table 3 to produce a log-log production plot showing multiple flow regimes (Fig. 10). The b-sigmoid analysis clearly shows different flow regimes out to true BDF where b = 0.5. The model behaves unbounded within the simulation time and b-values did not trend below 0.5 average, commensurate with well lateral boundaries far separated from the toe and heel both in the simulator and in the well.
Completion efficiency
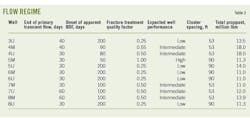
Completion efficiency was a focus of the HFTS project and can be considered a combination of created hydraulic fractures and connection of hydraulic fractures with existing natural fractures. Wells within the same landing zone with closest effective fracture spacing generally have earlier onset apparent BDF. End of primary transient flow and onset of apparent BDF for all 11 wells are listed in Table 3.
Well 5M had the fastest time to apparent BDF and was chosen as a benchmark for fracture treatment quality (FTQ). Table 3 also shows expected well performance, cluster spacing, and total proppant pumped. Expected relative performance is based on spacing and assumes that all wellbore laterals are drilled in the pay zone.
Tighter cluster spacing relates to early production gains, and data shows that most 90-ft spacings have lower performance than 53-ft spacings, except for benchmark 5M. Lowest FTQ are in outermost wells 3U and 8U in UW and the triple-zipper fracture-treated well group 5U, 6M, and 6U. All but one has 90-ft cluster spacing.
Wells 4M, 5M, and 8M have 53-ft fracture spacing and moved earlier into bubble point saturation, with rapid gas depletion relative to 6M and 7M with 90 ft spacing.
There was no correlation between total proppant pumped and well performance.
Fracture efficiency
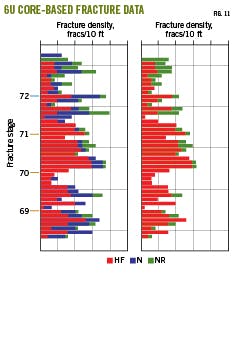
Fracture efficiency determination came from core analysis. Cores were obtained from the slanted observation well with 89-ft minimal distance from 6U Stage 23 and 135-ft from 6M. Cores were analyzed for hydraulic fractures, intact natural fracture (NF), and reactivated natural fractures (RF). Cores show clustering of HF swarms about ten times higher than the number of clusters in both 6U and 6M (90 ft spacing, three per stage in each well).
Drained rock volume (DRV) visualization from particle tracking technique based on complex analysis (CAM) determined reservoir recovery. The technique visualizes fluid withdrawal patterns around individual hydraulic fractures with and without nearby fractures. To construct DRV for 6U and 6M, workflow steps included:
- Compiling total fluid curves (gas, oil, and water) for each well.
- Allocating produced fluid to hydraulic fractures based on swarm density.
- Constructing DRVs for cases to compare impact of scaling DRV for heterogeneous flow due to interference of HF swarms and natural fracture network.
Hydraulic fracture density converts hydraulic fracture swarm data into an allocated fluid rate at each perforation cluster. Fig. 11 shows core fracture data for 6U with respect to fracture stage. Produced fluid is allocated back to each stage cluster based on hydraulic fracture density midway between the cluster spacing (90 ft for 6U and 6M). Well 6U has two stages with six clusters and 6M is modeled with one stage and three clusters. Both wells have 37 total stages, and production is prorated back to the number of modeled stages. Hydraulic fracture half-length and fracture height were 105 ft. Practical run times were obtained using only 12 natural fractures surrounding a single hydraulic fracture while maintaining equivalent permeability tensor of the representative rock volume.
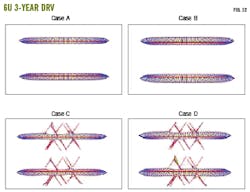
DRV for 30-year production in 6U and 6M were obtained using four case study assumptions:
- Case A: Base case which assumes uniformly spaced hydraulic fractures with identical fracture conductivity and equally prorated fluid flux, but without natural fractures.
- Case B: Fluid flux is prorated by core-observed hydraulic fractures to account for variation in density of hydraulic fracture swarms. After upscaling swarms, the DRV model evenly spaces hydraulic fractures
- Case C: Hydraulic fractures are uniformly spaced with identical fracture conductivity and equally prorated fluid flux. Natural fractures are upscaled by the method of Nandlal and Weijermars.1 Conductive natural fractures cause minor local distortions in the shape of the DRVs.
- Case D: Same as case C but with NF flux allocation based on field observations including the DRV model run.
Fig. 12 shows DRV reconstructions with these assumptions for 6U. For all cases, DRV is limited, reaching only about 10 ft into the reservoir space adjacent to the hydraulic fractures. There is little difference between DRVs based on uniform fluid allocation (Case A), and allocation weighed by fracture density (Case B). Even with addition of natural fractures (Cases C, D), interior regions between hydraulic fractures remain mostly undrained. Similar results were observed for 6M and argue for reducing spacing of hydraulic fractures below 90 ft, which is consistent with the completion efficiency analysis.
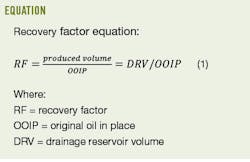
Recovery factor (RF) was obtained for 6U from DRV using Equation 1. DRV was computed using total fluid volume including water (assumed as native water drained from pore spaces). DRV-based volumes were obtained using a fraction of the formation thickness (up to 1/7 for UW) and significantly less than microseismic-derived hydraulic fracture heights. Well spacing was 213 acres. OOIP was estimated from the inter-well boundary between adjacent producing wells.
The recovery factor for 6U was 7.4%. While this is like RFs for Wolfcamp wells from other operators, the DRV-based RF estimates indicate that actual hydrocarbon volumes connected by the HF treatments are lower than OOIP regions between the wells. Modelling indicates unrecovered oil in the target zones which may be potentially recovered with infill wells.
References
- Nadlal, K. and Weijermars, R., “Impact on Drained Rock Volume (DRV) of Storativity and Enhanced Permeability in Naturally Fracture Reservoirs: Upscaled Field Case from Hydraulically Fractured Test Site (HFTS), Wolfcamp Formation, Midland Basin, West Texas,” 3852, Energies, Vol. 12, No. 20, October 2019.
About the Author
Alex Procyk
Upstream Editor
Alex Procyk is Upstream Editor at Oil & Gas Journal. He has also served as a principal technical professional at Halliburton and as a completion engineer at ConocoPhillips. He holds a BS in chemistry (1987) from Kent State University and a PhD in chemistry (1992) from Carnegie Mellon University. He is a member of the Society of Petroleum Engineers (SPE).
