Increased stage length complicates limited entry perforating
Extending stage length in unconventional wells can yield considerable cost savings, but doing so may negatively affect distribution of fracture treatment among perforation clusters. Limited-entry design minimizes cluster perforations to force uniform proppant distribution in long frac stages. It is an old technique but is now more difficult given ever-increasing stage lengths of unconventional wells.
Several intensive and expensive pilot programs conducted in the Permian and Midland basins studied limited entry, which incorporates distributed temperature surveys (DTS), distributed acoustic surveys (DAS), downhole camera surveys, and diagnostic pressure tests. Results reveal that limited entry is an effective tool for diversion, but that poorly designed or vetted perforating guns can negatively affect outcomes. Perforation erosion is one of the most important, yet unpredictable, consequences of limited entry treatments.
Limited entry
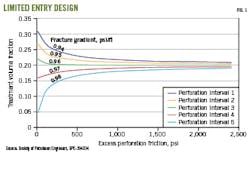
Variations in fracture propagation pressure within individual zones cause clusters in long frac stages to be treated unevenly. Pressure can vary initially due to in-situ local stresses and during treatment from stress shadowing, perforation erosion, reduced tortuosity, and other changes in net pressure. Limited entry reduces the number of perforations in a cluster to increase initial pressure drop across perforations, limiting any single cluster from taking too much fluid and proppant relative to the others. Fig.1 illustrates this effect.1,2
With perforation friction below 1,500 psi, frac stages require different volumes of treatment based on their interval frac gradient. Increasing perforation friction overwhelms the frac gradient effect, evening out the treatment.
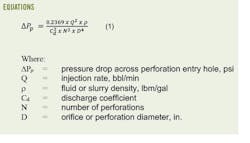
Of course, this illustration simplifies reality. Perforation friction is not easy to predict and maintain throughout the treatment. Perforation pressure drop is calculated from the Bernoulli equation (Equation 1) which shows that pressure drop is inversely proportional to perforation diameter to the fourth power. Small deviations in actual perforation diameter compared with predicted diameter can lead to large deviations in initial differential pressures.
While perforating companies do their best to obtain shot diameters from realistic test conditions, tests occur on the surface with targets that do not precisely correspond to downhole conditions. Downhole camera data have confirmed that diameters tend to be much different than expected. Cramer et. al. found deviations between measured and predicted perforation diameters of about 12% overall, with some perforation clusters having far higher deviations. No pre-frac camerawork was performed, and pre-stimulation diameter was assumed to be the short axis of the eroded perforation tunnel. In practice, the short axis was eroded to some degree and therefore initial perforation diameters were probably smaller than reported.
The expense and risk of running a camera survey and losing the camera downhole creates a reluctance to image perfs pre-frac. A practical suggestion is to perforate a cluster above the top fracked cluster at the end of the job so that a post-frac camera run has fresh, uneroded perforations to image along with the treated perforations. The new perforations will have no effect on well production.3
Erosion will occur during the treatment and, if severe, will compromise the limited entry scheme. It is important not only to know the perforation diameter for pressure drop calculations, but, if shooting in phasing other than 0°, the variation in perforation diameter around the wellbore. If guns are not perfectly centered, perforation diameters could vary directly with the distance between the gun body and casing. For example, camera data from 0°, 180° perforations (up, down) with an eccentric gun showed that the top shot had half the perforation diameter of the bottom shot.4 The solution to that problem came from working with a perforation company to prepare a gun that shot evenly around the wellbore with an eccentric carrier.
In the event of uneven perforation diameters, erosion rates can vary greatly among perforations. Roberts et. al. presented erosion data from shots on the high and low side of the well which showed significant erosion dispersion (Fig. 2).5 In this case, perforation pressure drop was uncontrolled and impossible to predict.
Cramer reported similar results, though not to the same degree, with pilot wells, in which one was shot with 60° phasing and the other at 0° (perfs at top). In this case, the dispersion in perforation diameters around the wellbore with 60° phased shots was not as serious an issue as debris filling lower perforations. This outcome not only made it hard to image some of the perfs, but strongly suggested that they were not required to treat the stage or reduce near-wellbore tortuosity. Treating pressures and production results from the 0° phased well were nearly identical. Eliminating uncertainty regarding debris filling lower perforations can only improve limited entry designs. The key to successful breakdown with 0° perforations is an effective acid job and scouring with 100 mesh sand to minimize near-wellbore tortuosity as much as possible.
While perforation erosion is impossible to accurately predict, general erosion patterns are known and erosion algorithms have been incorporated into several fracture modelling tools. Erosion is a two-step process, in which erosion initially rounds and smoothens the perf entrance hole, changing the discharge coefficient (Cd) as fluid streamlines flow more efficiently through the perforation. Pressure drop decreases, but is not related to hole size increase. The second erosion step is to increase hole size, resulting in a significant decrease in pressure drop. Both mechanisms require parameters which are difficult to predict and vary significantly with type of charge, location of charge relative to the casing, casing strength, proppant type, and fluid type.
Loehkin et. al. performed an intensive investigation into factors affecting discharge coefficient.6 Large-scale experimental set-ups mimicked perforation erosion by varying casing thickness and hole shape. Machined perforated plates were used as test specimens with straight holes, slotted holes, a conical convergent hole, and a conical divergent hole (Fig. 3). Conical divergent is usually how perforations form as the jet expands through the casing, leaving a larger exit hole diameter than entrance. Therefore, perforation diameter measurements usually reference entrance hole diameter (EHD). However, in cases with thick casing or weak charges, the holes can be conically convergent, with the exit hole the smaller of the two.
Discharge coefficients between these geometries averaged 0.830 Cd for conical convergent and 0.685 Cd for conical divergent. Clearly, accurate perforation pressure drop requires knowing the geometry of the perforation. Even when conical divergent is expected, charges, either due to age or temperature degradation, have produced conical convergent geometry upon subsequent lab testing.
By comparison, discharge coefficient had little dependence on casing thickness. Thicker casing had higher coefficient, but the effect was minimal compared with the conical shapes. Casing 0.94 in. thick had Cd of 0.730. Casing about a third of this thickness (0.29 in.) had Cd of 0.705, a difference of around 4%. Slot shape vs. round hole shape also had relatively low impact on Cd.
Flow measurements using jet perforated casing yielded different results than drilled hole casing. Burrs in the jet perforated holes had a large impact on flow streamlines and discharge coefficients were higher than for drilled holes. Sharp edges of drilled holes are known to contract fluid streamlines more than the rounded edges typically produced in jet perforating, resulting in lower Cd values. This observation is consistent with early perforation erosion tests in which Cd increased as the entrance hole was smoothed out.7 No correlation was observed between hole size and Cd values.
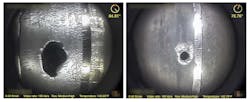
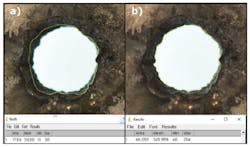
Parallax problems also emerge while imaging perforations. If the camera is not positioned exactly over the hole, side views distort the image and result in either erroneous open-area calculations, in which equivalent perf diameter is back-calculated from the area, or distorted direct axis observations. Fig. 4 shows this effect. The image at left is for a misaligned camera. The left side of the perforation wall is visible. The scribed line is the best guess of actual perforation shape. The image at right is the perforation with a properly aligned camera, requiring no guesses for perforation perimeter.
The second erosion mechanism, perf hole enlargement, is not as easily measured. Murphree et. al. combined ultrasonic perforation imaging, both pre- and post-treatment, with fiber optic temperature data to quantify fluid movement through the perforations in extreme limited-entry designs (four or less perfs per cluster).8 The manufacturer claimed charges to be equivalent in diameter regardless of phase, and pre-frac images registered average diameters within 7% of expected diameters, but with variances as high as 24%. Correlation of error with respect to phasing was not performed, but overall, the charges were deemed acceptable.
Post-frac, perforations in clusters identified as fracture initiation points by temperature data increased about 55% in diameter. Perforations that were not fracture initiation points had an average 53% increase, suggesting that fluid and proppant went through all clusters but that a distinct fracture network was not created for each cluster, perhaps due to loss of containment from communication behind pipe.
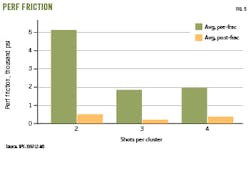
In either event, erosion was rapid and resulted in significant degradation of the perforation friction required for limited entry. Fig. 5 shows pre-perf friction compared to post-perf friction. Pressure drop across perfs began at 5,500 psi with two shots per cluster, or 1,900-2,000 psi with 3-4 shots per cluster, and dropped below 600 psi during the job. Stages were pumped with either low or high volumes of proppant to create an erosional model, but the required detail for such a model could not be discerned from the data. A comparison of perforation erosion to pounds of proppant per perforation only showed slight positive correlation, indicating that erosion occurred early in the stimulation. This agrees with yard-scale erosion studies in which the perforated plate eroded before the equipment was able to provide stable rate and pressure for baseline measurement.9
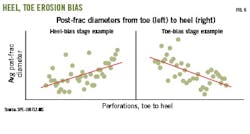
Erosion patterns along the wellbore showed better correlation to well trajectory. Fig. 6 shows heel and toe bias-eroded perforation diameters. These patterns correlate to the directional survey, where heel-bias erosion occurred in toe-up segments of the well, and toe-bias erosion occurred in toe-down segments (Fig. 7).
The correlation of erosion to deviation suggests that momentum may have as much effect on erosion as proppant loading. Velocity of eroding particles is a key component to erosion rates, and a study of metal screen pore erosion by sand scouring showed that dependence on erosion rate (ER) to sand velocity (V) was ER a V2.7.10 This supports a comment by Weddle that perforation imaging is useless to quantify proppant distribution in clusters based on post-frac perf dimensions.11
Murphree et. al. studied diverting agents as an aid to limited entry and found that stage spacing could be increased 25% even though the diverters did not open new clusters and were just an aid to redistributing proppant and fluid. Optimal perforation friction was 2,000-3,000 psi, which also agrees with observations from Weddle.
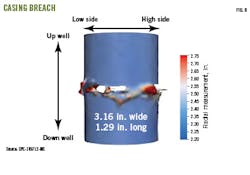
One of the most unexpected and alarming results of this study were images of casing breaches (Fig. 8). These were sporadic and observed near 16% of the frac plugs. Speculation is that casing becomes sandblasted as the fracture begins leaking near the sealing element of the plug. Breaches lose pressure containment, negating positive effects of limited entry.
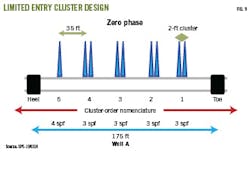
Cramer et. al. used diagnostic pressure tests, coupled with DTS and DAS analysis, to determine cluster efficiency. Improvements were recommended based on the findings. Initial completion design had five clusters in a stage with four perforations in the heel-most cluster and six perforations in the remaining four clusters for a total of 28 perforations per stage. Well A was perforated at 0° with shots near the top of casing and 4 shots/ft (spf) in the heel-most cluster as well as two groups of 3 spf in the six-shot clusters. Perforation pattern per stage is shown in Fig. 9. The skewed perforation distribution accounts for stress-shadowing from previous fracture treatments. Stress shadowing is less at the heel than toe, and lower-cluster five-perforation density prevents preferential flow into these perforations by increasing perf friction at the heel.
Analysis of all available data showed that just 50% of perforations were taking fluid. The treatment was designed for about 900-psi perf friction and the actual treating pressure showed slightly in excess of twice that amount. Regardless of the attempt to compensate for stress shadowing, the heel-most clusters took most of the fluid. Root cause of the underperforming clusters, however, was not stress shadowing but undersized perforations in the 0.28-0.30-in. range, significantly below the 0.40-in. spec expected by the vendor.
A proposed redesign sought to even out the injection rate among the clusters with more gradual variation in number of perforations per cluster, from 4, 6, 6, 6, 6, shots per cluster to 5, 5, 6, 7, 7 shots per cluster from heel to toe, but the recommendation was only a starting point because perforation erosion and ending perforation equivalent diameter is not fixed or accurately predicted. Field data would be required to adjust the initial estimate. Based on Well A perforation imaging, better quality control of perforation vendors would also be required.
The conclusion of the described work is that perforation erosion is still highly unpredictable without adequate models or lab data to pull from, causing uncertainty between limited-entry design and actual treatments. Weddle addressed this by adopting the extreme limited-entry strategy with only one shot per cluster. This was done to limit uncertainty in designs or adjustments needed in the field based on pre-proppant step-down rate tests.12 In two-shot per cluster designs, for example, breakdown of only one perf limits fluid entry by 50% from initial design. Relative fluid distribution could be much worse with a six-shot per cluster design where the majority of perfs do not break down, especially if the breakdown is uneven from cluster to cluster. Efforts to induce breakdown of all perforations through rate-cycling, acid spearheads, and sand slugs is important, but statistically it is rare to get 100% of perfs open on every stage. A one-perf cluster either takes fluid or not, breaks down under stress or not, and can be calculated from a step-down test that allows job size and pump rate adjustment on the fly to further minimize variability on a per-cluster treatment basis.
Perforation friction is high in one-shot per cluster limited entry, but like Murphree et. al., Weddle recommends no more than 3,000 psi initial pressure drop across the perf and suggests where possible to increase rate throughout the job to maintain limited entry as erosion occurs. This approach does not account for stress shadowing as found in the multiple-perforation-per-cluster strategy, but with more transparent cluster breakdown and treatment, diagnostic pressure analysis is simpler.
References
- Cramer, D., Friehauf, K., Roberts, G., and Whittaker, J., “Integrating Distributed Acoustic Sensing, Treatment-Pressure Analysis, and Video-Based Perforation Imaging to Evaluate Limited-Entry-Treatment Effectiveness,” SPE-194334, SPE Hydraulic Fracturing Technology Conference and Exhibition, The Woodlands, Tex., Feb. 4-6, 2020.
- Martin, T., Kotov, S., and Nelson, S.G., “Stimulation of Unconventional Reservoirs, Perforation Strategy,” Unconventional Oil and Gas Resources Exploitation and Development, CRC Press, Ahmed, U., Meehan, D.N., ed., Ch. 17, Boca Raton, Fla., 2016.
- Murphree, C., Kintzing, M., Robinson, S., and Sepehri, J., “Evaluating Limited Entry Perforating & Diverter Completion Techniques with Ultrasonic Perforation Imagine & Fiber Optic DTS Warmback,” SPE-199712-MS, SPE Hydraulic Fracturing Technology Conference and Exhibition, The Woodlands, Tex., Feb. 4-6, 2020.
- Craig Wittenhagen, Chesapeake Energy, private communication.
- Roberts, G., Whittaker, J.L., and McDonald, J. “A Novel Hydraulic Fracture Evaluation Method Using Downhole Video Images to Analyze Perforation Erosion,” SPE-191466-18IHFT-MS, SPE International Hydraulic Fracturing Technology Conference and Exhibition, Muscat, Oman, Oct. 16-18, 2018
- Loehkin, J., Yosefnejad, D., and Fricke, B., “Experimental Investigation on Parameters Affecting the Coefficient of Discharge of a Perforation Hole in Hydraulic Fracturing Treatments,” SPE-199746-MS, SPE Hydraulic Fracturing Technology Conference and Exhibition, The Woodlands, Tex., Feb. 4-6, 2020.
- Cramer, D.D., “The Application of Limited-Entry Techniques in Massice Hydraulic Fracturing Treatments,” SPE-16189-MS, SPE Production Operations Symposium, Oklahoma City, Okla., Mar. 8-10, 1987.
- Weddle, P., Griffin, L., and Pearson, C.M., “Mining the Bakken II- Pushing the Envelope with Extreme Limited Entry Perforating,” SPE-109880-MS, SPE Hydraulic Fracturing Technology Conference and Exhibition, The Woodlands, Tex., Jan. 23-25, 2018.
- Procyk, A., Cramer, D., unpublished data.
- Procyk, A., Gou, X., Marti, S., Burton, R., Knefel, M., Dreschers, D., Wiegmann,A., Cheng, L., and Glatt, E., “Sand Control Screen Erosion: Prediction and Avoidance,” SPE-174837-MS, SPE Annual Technical Conference and Exhibition, Houston, Tex., Sept. 28-30, 2015.
- Weddle, P., “Right-Sizing Cluster and Stage Count Using Extreme Limited Entry Completion Designs,” SPE Gulf Coast Section Westside webinar, May 20, 2020.
- Weddle, P., personal communication, June 2, 2020.
About the Author
Alex Procyk
Upstream Editor
Alex Procyk is Upstream Editor at Oil & Gas Journal. He has also served as a principal technical professional at Halliburton and as a completion engineer at ConocoPhillips. He holds a BS in chemistry (1987) from Kent State University and a PhD in chemistry (1992) from Carnegie Mellon University. He is a member of the Society of Petroleum Engineers (SPE).
