Planned maintenance to slow first-half 2016 ethylene production
Dan Lippe
Petral Consulting Co.
Houston
From the perspective of feedstock pricing and production costs, the latter part of 2015 provided as much turmoil as the first half, but US ethylene producers turned in two quarters of nearly perfect operational performance in second-half 2015. Industry operating rates fell below 90% for only one month in second-half 2015 to average 93% for the last 6 months of the year.
US ethylene producers set two new high records for monthly production rates in second-half 2015. The first occurred in June (161 million lb/day), with a second in December (166 million lb/day). The first record high exceeded the previous record by 4.7 million lb/day (3%), while the second record high exceeded its predecessor by 5 million lb/day (3.2%). Ethylene producers also set new records for ethane consumption, propane consumption, and total demand for fresh feed.
In the US Gulf Coast propylene market, the inventory surplus of first-half 2015 gradually declined during second-half 2015 and disappeared altogether, if only temporarily, by yearend. The inventory surplus of first-half 2015 left propylene marketers wondering how US propylene markets would absorb the significant increase in production when the first two of five planned propane dehydrogenation (PDH) plants come on stream in 2016. A partial answer to this question emerged in second-half 2015, as did equally important pricing trends that provided insight into the economic impact of increased production from the two new PDH plants.
Ethylene production
Petral Consulting Co. tracks US ethylene production via the results of a monthly survey of operating rates and feed slates. Results of the monthly surveys show ethylene production was 159.5 million lb/day in third-quarter 2015, up by a total of 511 million lb (3.6%) from second-quarter 2015. For fourth-quarter 2015, survey results showed ethylene production at 159.6 million lb/day, virtually unchanged from the previous quarter.
Compared with the same quarter during 2014, US ethylene production during third-quarter 2015 was up by 934 million lb (6.8%), while production during fourth-quarter 2015 was 799 million lb (5.8%) more than the same period in 2014.
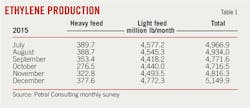
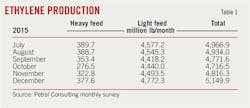
Production losses in third-quarter 2015 due to turnarounds and unplanned maintenance problems stood at 761 million lb, 215 million lb less than in the previous quarter. Production losses in fourth-quarter 2015 were 651 million lb, which was 110 million lb less compared with the third quarter (Table 1).
Compared with the first 6 months of 2015, ethylene plants in Texas during second-half 2015 increased production by 2.79 million lb/day, while second-half production from Louisiana plants increased by 3.76 million lb/day. Louisiana's increased production during second-half 2015 helped reduce the state's chronic ethylene shortfall, as well as its need to import volumes from Texas.
Ethylene production from Louisiana plants averaged 41.7 million lb/day in third-quarter 2015 and 40.0-40.2 million lb/day in the fourth quarter. The two new production records set by US ethylene producers during second-half 2015 are a result of Louisiana's increased output during the period.
Fig. 1 shows trends in ethylene production.
Feedstock prices
In second-quarter 2015, crude oil prices staged a bear-market correction, which appeared to have run its course by mid June. A second leg of the current bear-market, however, began in the last week of June.
Spot prices for West Texas Intermediate (WTI) were $59.81/bbl in June 2015 before dropping $17/bbl (28.5%) to $42.77/bbl in August. While prices staged a very modest rally in September and October, the downtrend persisted through yearend to leave WTI's average spot price at $37.26/bbl in December. As 2016 began, a crash in China's stock market sparked a 4-day global sellers' panic (Jan. 8-12), sending WTI pricing into a freefall. During the week of Jan. 11-15, 2016, spot prices for WTI fell below $30/bbl for the first time since 2003.
Ethylene feedstock prices in second-half 2015 generally tracked the trend in crude oil prices, with spot prices for unleaded regular gasoline, naphtha, and NGL all declining alongside the lower oil price. Propane prices in Mont Belvieu, Tex., fluctuated from lows of 37-38¢/gal during August and December to highs of 45-46¢/gal in September and October.
Spot prices for non-TET normal butane fell to lows of 52-55¢/gal in July and August before hitting highs of 61-62¢/gal in October and November. ("TET" is short for "Texas Eastern" and refers to petroleum products in the Texas Eastern storage at Mont Belvieu, now owned and operated by Lone Star NGL LLC, an operating unit of Energy Transfer Partners. "Non-TET" refers to product at Mont Belvieu but in other owners' facilities.)
Spot prices for purity ethane increased to 19.5-20.0¢/gal in October from 18.5-19.0¢/gal in July before falling to 15.0-15.5¢/gal. The slump in purity ethane prices in fourth-quarter 2015 was consistent with the decline in wellhead natural gas prices and shrinkage values.
When feedstock prices fall, ethylene production costs also usually decline unless coproduct prices buck the trend.
From second-quarter to third-quarter 2015, spot prices for propylene declined by 10¢/lb (28%) to average 29.5¢/lb (polymer-grade propylene) and by about 13¢/lb (44%) to average 20¢/lb (refinery-grade propylene), according to PetroChem Wire's daily olefin price reports (www.petrochemwire.com). Contract settlements for polymer-grade propylene were 32.9¢/lb in third-quarter 2015 vs. 41.7¢/lb the previous quarter.
During fourth-quarter 2015, however, contract settlements for polymer-grade propylene bucked the general bearish trend to stage a modest recovery. After falling to a low of 29.3¢/lb in September, contract settlements increased to 32¢/lb in December for an overall average settlement price of 31.3¢/lb in the fourth quarter. Spot prices for polymer-grade propylene also rebounded during the last quarter of 2015, rising to 28.5-29.0¢/lb.
Contract settlements for refinery-grade propylene, in contrast, weakened in October and November to 18-19¢/lb, leaving overall contract pricing at an average of 19¢/lb for fourth-quarter 2015.
Contract settlements for purity butadiene jumped to 40¢/lb in August from 35.75¢/lb in July but dropped to 35.38¢/lb in September to average 37.1¢/lb in third-quarter 2015. Contract settlements tracked the decline in prices for motor gasoline prices and octane values in fourth-quarter 2015 to average 32.4¢/lb. Spot prices for aromatics also tracked the decline in gasoline prices and octane values in second-half 2015. Spot prices for toluene were 245¢/gal in third-quarter 2015 and 208¢/gal in the fourth quarter.
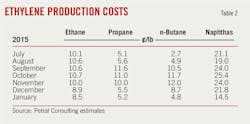
Ethylene production costs based on purity ethane feeds averaged 10-11¢/lb in the third and fourth quarters of 2015, nearly unchanged compared with the first half of the year. Purity ethane provided a cost savings of 11¢/lb vs. natural gasoline in third-quarter 2015, with those cost savings rising to 14¢/lb in fourth-quarter 2015. Production costs for purity ethane were more than for propane in July and August, but purity ethane regained a small cost advantage vs. propane in September. Ethane's cost disadvantage vs. propane was 4-5¢/lb in July and August. Production costs based on purity ethane remained at parity with propane costs in October and November. In December, however, ethane was 4.5¢/lb more expensive than propane.
Production costs for purity propane were 7.4¢/lb in third-quarter 2015 and rose to 8.8¢/lb in the fourth quarter, but production costs dropped to 5.5¢/lb in December vs. 11-12¢/lb in October and November. In third-quarter 2015, production costs for propane provided producers with a cost savings of 14¢/lb vs. natural gasoline. In fourth-quarter 2015, propane's cost advantage vs. natural gasoline increased to 15¢/lb.
Production costs for natural gasoline started second-half 2015 at 21¢/lb and, after falling to 19¢/lb in August, rallied to 24¢/lb in September. Production costs for natural gasoline increased again in October (25.4¢/lb) before weakening to 24¢/lb in November and 22¢/lb in December. Production costs for fourth-quarter 2015 averaged 24¢/lb (Table 2).
Ethylene pricing, profit margins
After remaining relatively stable during first-half 2015, ethylene spot prices declined in 4 of 6 months during the second half of the year. PetroChem Wire daily reports showed spot prices for ethylene at Williams Hub averaged 28¢/lb in third-quarter 2015, some 8¢/lb (23%) less than in second-quarter 2015. Spot prices averaged 21¢/lb in fourth-quarter 2015, which was 6.6¢/lb (24%) less compared with the previous quarter.
With ethylene pipelines in service and production in Louisiana at record-high levels during second-half 2015, spot prices for ethylene at Choctaw Dome were never more than 0.8¢/lb higher than spot prices at Williams Hub during the period. Spot ethylene prices at other storage locations in Mont Belvieu during the second half of the year remained 1¢/lb below pricing at Williams Hub.
Net transaction prices (NTP) in third-quarter 2015 declined 5.25¢/lb from the previous quarter to 28.5¢/lb in September, averaging 30.25¢/lb for the quarter. NTP prices continued to decline in fourth-quarter 2015 but at a slower rate. After settling at 25.75¢/lb in December, NTP prices ended the fourth quarter at an average of 27.5¢/lb.
Margins based on NTP were 21-23¢/lb for purity ethane during second-half 2015 but slipped to 20.6¢/lb in December. Margins for propane also were 21-23¢/lb in the last two quarters of 2015. Margins based on propane averaged 27¢/lb in the third quarter and 22.8¢/lb in the following quarter. Margins for natural gasoline and light naphtha of similar quality improved to 14¢/lb in third-quarter 2015 but fell to 9¢/lb in the fourth quarter.
Fig. 2 shows historic trends in ethylene prices (spot prices and NTP).
Fig. 3 shows profit margins based on spot ethylene prices and variable production costs.
Olefin-plant feed slate trends
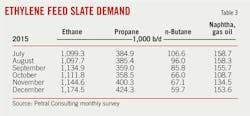
Petral Consulting's monthly survey of plant operating rates and feed slates showed ethylene industry demand for fresh feed was 1.74 million b/d in third-quarter 2015 and 1.73 million b/d in fourth-quarter 2015. Demand for fresh feed in third-quarter 2015 was 43,400 b/d (2.6%) more than second-quarter 2015. Demand for fresh feed in fourth-quarter 2015 was unchanged from the previous quarter.
Demand for NGL feeds (ethane, propane, and normal butane) was 1.58 million b/d in third-quarter 2015 and 1.60 million b/d in fourth-quarter 2015.
Demand for NGL feed in third-quarter 2015 was 46,000 b/d (3.0%) more than in second-quarter 2015, while demand in fourth-quarter 2015 was 19,000 b/d (1.2%) more compared with the third quarter. NGL feeds accounted for 91-92% of fresh feed in second-half 2015 (Table 3).
Fig. 4 shows historical trends in ethylene feed.
US propylene production
Coproduct propylene supply depends primarily on the use of propane, normal butane, naphtha, and other heavy feeds. The monthly survey shows demand in third-quarter 2015 was 376,000 b/d for propane, 96,100 b/d for normal butane, and 157,600 b/d for heavy feeds. In fourth-quarter 2015, demand for propane was 394,400 b/d, while demand for normal butane was 64,300 b/d. Demand for heavy feeds was down to 132,200 b/d.
Total demand for feeds with high propylene yield was 630,100 b/d in third-quarter 2015, which was 17,000 b/d (2.8%) more than in second-quarter 2015 and 67,400 b/d (12%) more than in third-quarter 2014. Total demand for these feeds in fourth-quarter 2015 was 590,900 b/d, which was 39,300 b/d (6.2%) less than in third-quarter 2015 but 9,300 b/d (1.6%) more than in the same quarter last year. As economic incentives for propane and normal butane vs. ethane improved during second-half 2015, ethylene producers increased their use of propane and butane in third-quarter 2015 and maintained demand for heavy feeds. In fourth-quarter 2015, however, demand for propane increased by 18,000 b/d, demand for butane declined by 32,000 b/d, and demand for heavy feeds declined by 25,000 b/d compared with the previous quarter. While reduced demand for butane came amid normal seasonal considerations, demand reductions for heavy feeds resulted from scheduled turnarounds and downtime at a few key propylene plants.
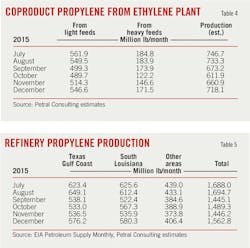
Petral Consulting estimates coproduct supply in third-quarter 2015 averaged 23.4 million lb/day to reach its highest level in the past nine quarters. Although ethylene plants continued to operate at high rates in fourth-quarter 2015, a temporary decline in demand for heavy feeds reduced coproduct supply to 21.5-21.8 million lb/day. Coproduct supply for third-quarter 2015 was 80 million lb (3.8%) more than in second-quarter 2015 and 213 million lb (11%) more than in third-quarter 2014. Coproduct supply in fourth-quarter 2015 was about 160 million lb (7.5%) less than in third-quarter 2015 but equal to volumes in fourth-quarter 2014.
Coproduct supply from light feeds increased to 17.5 million lb/day in third-quarter 2015 but declined to 16.9 million lb/day in fourth-quarter 2015. Production from light feeds in third-quarter 2015 was 205 million lb (14.6%) more than in third-quarter 2014, while production from light feeds in fourth-quarter 2015 was 91 million lb (6.3%) more than in fourth-quarter 2014. Demand for both propane and normal butane in third-quarter 2015 was more compared with the same period in 2014. Demand for propane in third-quarter 2015 was 46,500 b/d (14.0%) more than in third-quarter 2014. In fourth-quarter 2015, demand for propane was 17,900 b/d more compared with the previous quarter and 41,900 b/d more from fourth-quarter 2014 (Table 4).
PDH plants, refineries
According to PetroChem Wire, propylene production from the PDH plant in the Houston Ship Channel rebounded in third-quarter 2015 to 3.7 million lb/day. Downtime for a scheduled turnaround reduced propylene production by 2.3-2.4 million lb/day in November but output recovered in December. Dow Chemical Co., Midland, Mich., also commissioned a new 750,000 tonne/year PDH unit at its Oyster Creek site in Freeport, Tex., in December, the company said in a press release. Petral Consulting estimates propylene supply from PDH plants in December was 4.2-4.4 million lb/day and averaged 3.2-3.3 million lb/day in fourth-quarter 2015.
Refinery propylene sales into the merchant market are a function of:
• Fluid catalytic cracking unit (FCCU) feed rates (most important variable).
• FCCU operating severity (important but not directly measurable).
• Economic incentive to sell propylene rather than use it as alkylate feed.
Variations in FCCU feed rates are the most important parameter. Economic factors affect operating severity and are generally of secondary importance.
Statistics from the US Energy Information Administration (EIA) indicate US refineries operated FCCUs at 5.1 million b/d in third-quarter 2015 and an estimated 4.7-4.9 million b/d in fourth-quarter 2015. Feed rates for all FCCUs in third-quarter 2015 were 156,000 b/d (3.1%) more than in second-quarter 2015 and 102,000 b/d (2.0%) more than in third-quarter 2014. The increase in FCCU feed rates in third-quarter 2015 was consistent with seasonal patterns in refinery crude runs. The drop in feed rates during the fourth quarter also was consistent with seasonal trends.
Regionally, EIA statistics showed feed rates for FCCUs in the Gulf Coast and Midcontinent at 3.61 million b/d in third-quarter 2015, 150,700 b/d (4.4%) more than in second-quarter 2015. Feed rates for these FCCUs were 3.35-3.40 million b/d in fourth-quarter 2015, 234,000 b/d (6.5%) less than in third-quarter 2015.
While spot prices for refinery-grade propylene in the Houston Ship Channel market fell below unleaded regular gasoline prices in April 2015 and remained discounted through yearend, EIA reported propylene production from all US refineries increased to 52.4 million lb/day in third-quarter 2015, yielding 230 million lb (5.0%) more total production than in third-quarter 2014. EIA reported refinery-grade propylene supply fell to 48 million lb/day in October. Petral Consulting estimates refinery-grade propylene supply was 48-50 million lb/day in November and December for a total production decline of 330 million lb in third-quarter 2015 and 420 million lb in fourth-quarter 2014.
Refineries in the Gulf Coast and Midcontinent are the primary supply sources of refinery-grade propylene for chemical markets in the Gulf Coast. EIA reported production from refineries in the Gulf Coast and Midcontinent as 48.5 million lb/day in third-quarter 2015 and 46-47 million lb/day the following quarter.
Production from Gulf Coast and Midcontinent refineries in third-quarter 2015 was 153 million lb (3.5%) more than in second-quarter 2015 and 516 million lb (13.1%) more than in third-quarter 2014 even though refinery grade propylene prices were discounted 5-9¢/lb vs. unleaded regular gasoline. Refinery-grade propylene supply from Gulf Coast and Midcontinent refineries in fourth-quarter 2015 declined to 45-46 million lb/day, resulting in about 320 million lb less total production than third-quarter 2015 and 134 million lb less than fourth-quarter 2014 (Table 5).
Propylene economics, pricing
EIA statistics for refinery-grade propylene and Petral Consulting's estimates for coproduct supply indicate total US propylene production was 79.6 million lb/day in third-quarter 2015 but declined to 73.5-74.0 million lb/day in fourth-quarter 2015. The most significant changes in US propylene supply for second-half 2015 vs. the same period in 2014 resulted from increased coproduct production.
Fig. 5 shows trends in coproduct and refinery merchant propylene sales, as reported by EIA.
Two factors greatly influence propylene pricing. Refinery-grade propylene supply tracks seasonal variations in refinery crude runs and FCCU feed rates. Seasonal variations in refinery crude runs and FCCU feed rates are reasonably predictable, and propylene supply-demand balances are usually tighter in winter than in summer.
Propylene price relationships vs. unleaded regular gasoline vary directly with seasonal variations in the propylene supply-demand balance.
Under normal market conditions, propylene in reportable Gulf Coast storage varies by ±25% of the midrange of long-term historic inventory levels.
Occasionally, however, inventory levels fall outside the historic range. When inventory in reportable storage at the Gulf Coast increases to more than 770 million lb, spot prices for refinery-grade propylene tend to decline and premiums vs. unleaded regular gasoline weaken.
On July 1, propylene inventory in reportable Gulf Coast storage was 960 million lb for an increase of almost 300 million lb during first-half 2015, raising inventory 43% above the 3-yr average, according to EIA. Spot prices for refinery-grade propylene were 4.5¢/lb less compared with unleaded regular gasoline prices in June, with that discount widening to 8.6¢/lb in July before narrowing to 7.8¢/lb in August for an overall average discount of 7.4¢/lb in the third quarter.
After July 1 and across third-quarter 2015, inventory in reportable Gulf Coast storage experienced a gradual decline before sharply falling in October to stand at 680 million lb Nov. 1, 2015. Following continued declines during November and December, inventory on Jan. 1, 2016, stood at 576 million lb, 14% lower than the 3-yr average, according to EIA weekly statistics. As inventory declined, propylene's price discount to unleaded regular gasoline narrowed to just 0.6¢/lb in December 2015.
According to PetroChem Wire, spot prices for refinery-grade propylene were 16.4¢/lb in September and averaged 19.7¢/lb for third-quarter 2015, down by 13¢/lb from the previous quarter. In October and November, however, spot prices rebounded to average 18.8¢/lb for fourth-quarter 2015 as a result of seasonal decreases in supply and shrinking inventory.
In third-quarter 2015, contract benchmark pricing for polymer-grade propylene dropped 10.75¢/lb from the previous quarter to hit its lowest level since April 2009, with contract prices settling at 29.25¢/lb in September compared with 40¢/lb in June. Despite falling prices for crude oil and motor gasoline during fourth-quarter 2015, refinery-grade propylene pricing increased progressively over the 3-month period to reach a cumulative quarterly average of 32¢/lb in December. Liquidation of surplus inventory during third-quarter 2015 alongside anticipation of the seasonal decline in refinery-grade propylene supply supported stronger propylene prices during the final quarter.
Polymer exports
The most important end-use markets for ethylene and propylene are production of polyethylene and polypropylene. US production of polyethylene and polypropylene has exceeded domestic demand for at least 30 years, and export markets have always absorbed the surplus in US supplies. Export sales were generally 20-25% of domestic production for polyethylene and 15-20% for polypropylene.
During 2017-2020, petrochemical companies in North America will start up 20 billion lb/year of new ethylene and polyethylene capacity and 8.2 billion lb/year of PDH plant capacity. As production increases by an estimated 30-35%, the US will triple or quadruple its polyethylene exports to destinations other than Canada and Mexico. Whereas most new ethylene capacity will feed new polyethylene plants, only two of the five or six new PDH plants will deliver propylene to new polypropylene plants. As a result, US propylene monomer exports will increase as US propylene supply increases by 25%. Beginning in 2015 (OGJ Online, Sept. 7, 2015, p. 96), the scope of this article series expanded to include an overview of US exports of the industry's primary polymers.
Polyethylene
According to US International Trade Commission (ITC) statistics, US exports of polyethylene (high-density polyethylene, low-density polyethylene, and linear low-density polyethylene) during 2010-14 were relatively constant at 18-20 million lb/day, 45-50% of which moved to Canada and Mexico. US polyethylene exports during third-quarter 2015 averaged 21.5 million lb/day, down by 1.3 million lb/day (5.6%) compared with second-quarter 2015. During fourth-quarter 2015, exports rose by 2.62 million lb/day (12.2%) from the previous quarter to 24.2 million lb/day in October and November to leave total US polyethylene exports in second-half 2015 at 22.6 million lb/day, 5.5 million lb/day (32%) more than the same period in 2014. In July-November, combined polyethylene exports to Canada and Mexico were up 1.2 million lb/day from second-half 2014 to 11.0 million lb/day, accounting for 49% of total exports.
US polyethylene exports to rest-of-world (ROW) destinations were 10.5 million lb/day during second-half 2015, up by 3.3 million lb/day (46%) from second-half 2014.
Propylene, polypropylene
ITC statistics show US exports of propylene monomer were 2.1 million lb/day in 2007 but declined steadily during 2008-14 to only 0.6 million lb/day in 2014.
During first-quarter 2015, propylene monomer exports to Colombia fell to 0.3 million lb/day before rebounding to 1.8 million lb/day in second-quarter 2015 and 2.57 million lb/day in the third quarter. Exports reached record-high volumes of 2.9 million lb/day in July and 2.6 million lb/day in August.
Propylene monomer exports to Europe, normally less than 5,000 lb/day, surged to 1.11 million lb/day in June and 1.44 million lb/day in July. Supply problems in Europe were temporary, however, and exports dropped to typical volumes of 4,000-7,000 lb/day in September through November.
Total US polypropylene exports were 12.1 million lb/day in 2007 but declined steadily during 2008-14 to just 5.9 million lb/day in 2014, according to ITC data. Similar to the geographic disposition of US polyethylene exports, Mexico and Canada were the primary destinations for US polypropylene exports.
In second-half 2015, polypropylene exports to all destinations averaged 5.80-5.85 million lb/day. Exports to Mexico and Canada were 4.70-4.75 million lb/day, about 80% of total exports.
US polypropylene exports in third-quarter 2015 were 6.3 million lb/day, 0.43 million lb/day (6.4%) less than in second-quarter 2015 but 0.19 million lb/day more than in 2014. Based on ITC data for October and November, Petral Consulting estimates exports in fourth-quarter 2015 were 5.0-5.2 million lb/day, about 1.2-1.3 million lb/day (19-20%) less than third-quarter 2015 and 0.3-0.4 million lb/day (5.8-6.0%) less than fourth-quarter 2014.
2016
The outlook for ethylene during second-half 2016 depends on trends in production costs and demand for derivatives. Additionally, production always depends on downtime for turnarounds and unplanned maintenance problems.
During 2010-2014, US ethylene capacity utilization rates did not exceed 91% for two or more consecutive quarters until second-half 2013. In second-half 2015, downtime due to turnarounds averaged less than historical levels, while capacity utilization averaged 91-93% for three consecutive quarters. Historically, capacity utilization rates have never reached 91% or higher for more than three consecutive quarters. Petral Consulting expects more capacity will be out of service in first-half 2016 due to planned turnarounds, which could reduce ethylene production to as low as 145-150 million lb/day for a few months.
The increase in exports of polyethylene during second-half 2015 is a positive indicator for ethylene demand in first-half 2016. Petral Consulting, however, forecasts polyethylene exports for the first 6 months of 2016 will slip below second-half 2015 volumes amid curtailments to total ethylene production.
The decline in ethylene production for 2 or 3 months during first-half 2016 will require either an offsetting reduction in ethylene demand or significant inventory liquidation.
The economic outlook for ethylene is a function of feedstock and coproduct prices, with trends in crude oil prices determining price trends for both feedstock and coproducts.
Crude oil price forecasts are always subject to uncertainty, and forecasts for second-half 2016 are no exception. Although US refineries continued to run at peak summer rates in January and inventory builds remained below historical averages, crude oil prices entered a freefall during the first 2 weeks of 2016. The imminent increase in Iranian crude oil exports and the possibility that Libya will increase production will reinforce downward pressure on global crude oil prices.
During the 4-day crash in global stock markets (Jan. 8-12), the price of Dated Brent declined by $4.50/bbl (14.2%), followed by an additional drop of $2.96/bbl (9.7%) Jan. 13-20. During the first 3 weeks of January, prices for all major benchmarks declined $9-10/bbl (28-29%). Prices previously declined by 25-30% during a 4-week period in February-March 1986 and October-November 2008. In the current market, however, Saudi Arabia and Iran are determined to rebuild market share regardless of the impact on prices in the short term, and Libya, too, may return to full production. During first-half 2016, these and other factors will continue to exert downward pressure on crude oil prices.
Until US crude oil production slides into a period of persistent decline, crude prices will remain weak. Petral Consulting's ethylene production-cost forecasts for first-half 2016 are based on Dated Brent and WTI in the range of $26-30/bbl.
Most likely, ethane will yield ethylene production costs of 8-10¢/lb, with propane costs at 5-7¢/lb, and natural gasoline costs at 5-8¢/lb. Ethane will be consistently more expensive than propane across first-half 2016 and more expensive than natural gasoline in second-quarter 2016.
While ethylene spot prices fell below 17¢/lb for a few days in mid-January, prices generally remained between 19-20¢/lb as the year began. Since ethylene production is likely to be 10-15 million lb/day less for a few months during first-half 2016 compared with December 2015, Petral Consulting expects ethylene spot prices to hold steady at 18.5-20.5¢/lb. Profit margins (spot ethylene price minus production costs) for all feeds will be 10-15¢/lb.
After first-quarter 2016, the outlook for propylene becomes persistently bleak. By May-June, refinery-grade propylene production will reach peak seasonal rates, while coproduct production will rebound to 22-23 million lb/day. Propylene from PDH plants also will increase to 6-7 million lb/day in second-quarter 2016. Spot prices for refinery-grade propylene will fall to 14-16¢/lb, and contract settlements for polymer-grade propylene will fall to 25-27¢/lb.
Feedstock prices, coproduct values, and ethylene plant yields determine ethylene production costs. Petral Consulting maintains direct contact with the olefin industry and tracks historic trends in spot prices for ethylene and propylene. We use a variety of sources to track trends in feedstock prices.
Some ethylene plants have the necessary process units to convert all coproducts to purity streams. Some ethylene plants, however, do not have the capability to upgrade mixed or crude streams of various coproducts and sell some or all their coproducts at discounted prices. We evaluate ethylene production costs in this article based on all coproducts valued at spot prices.
The author
Daniel L. Lippe ([email protected]) is president of Petral Consulting Co., which he founded in 1988. He has expertise in economic analysis of a broad spectrum of petroleum products including crude oil and refined products, natural gas, natural gas liquids, other ethylene feedstocks, and primary petrochemicals.
Lippe began his professional career in 1974 with Diamond Shamrock Chemical Co., moved into professional consulting in 1979, and has served petroleum, midstream, and petrochemical industry clients since. He holds a BS (1974) in chemical engineering from Texas A&M University and an MBA (1981) from Houston Baptist University. He is an active member of the Gas Processors Suppliers Association.
