Water saturation models greatly affect reserves calculations
Among the challenges in water saturation and hence oil saturation calculations are the accuracy of the applied model and the accuracy of its input parameters. Even in the most simplistic reservoirs where the Archie model is applicable, these parameters affect the accuracy of the calculated saturation.
Many in the petroleum industry focus on one parameter, namely Rt or true formation resistivity, thinking that it is the most important factor in all applications.
Sometimes companies spend thousands of dollars trying to perfect this parameter, although an erroneous Rt might not generate the largest errors.
This article discusses all the saturation input parameters, namely: formation water resistivity, true formation resistivity, the saturation exponent, and the cementation exponent. In addition, it also covers the effects of these parameters on the accuracy of the saturation model.
Water saturation models
Hydrocarbon reserves calculations represent an ongoing challenge to the industry because of its impact on the required spending on facilities and field development. The calculations require continuous updates and careful selection of parameters and various methodologies.
The analysis in this article calculates reserves based on reservoir parameters, mainly the porosity and water saturation. With regard to porosity, the industry has many tools available that measure accurate values within reasonable error margins. Therefore, the article will not discuss porosity and will consider it as a controllable parameter.
But the industry has no direct method for measuring water saturation. Water saturation is an interpreted parameter that is affected greatly by the accuracy of the components of the model used in the calculations. The industry has many saturation models and the selection of the one that best fits a certain reservoir depends on the geology and rock properties of that reservoir.
For example, in a simple sandstone reservoir with almost no shale, the Archie saturation parameter is adequate. When the sandstone contains more shale, the Archie equation will not fit. In this case, another model may be more appropriate.
When the shale content becomes more complex, the calculations will require more complicated saturation models to accommodate the effect of shale mineralogy and claycation-exchange capacity on rock resistivity. The Waxman-Smits and the Dual Water are two models that can handle this complexity.
Although the proper choice of the saturation model represents a challenge, a greater challenge is the selection of the parameters. Selection of the proper cementation and saturation exponents is critical.
Because tools for measuring these parameters downhole are unavailable, some rely on limited laboratory core analysis to provide averaged values for the entire field.
Saturation models
As mentioned previously, saturation models range between very simple, such as the Archie model, to very complex such as the Waxman-Smits model. The model selection is based on the rock and geology of the reservoir.
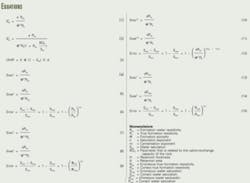
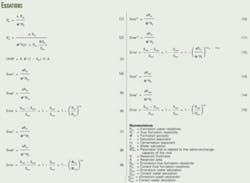
The Archie equation, Equation 1 (see equation box), is accurate for simple sandstone rock with a minimum shale component. In the equation, Rw is the formation water resistivity, Rt is the true formation resistivity, Φ is formation porosity, n is the saturation exponent, m is the cementation exponent, and Sw is the water saturation.
On the other hand, rocks with a high shale component require a more complex model such as the Waxman-Smits (Equation 2). This model provides greater accuracy compared to other saturation models.
The Waxman-Smits equation contains the BQv parameter, which is related to the cation-exchange capacity of the rock. This parameter represents the effect of shale on the resistivity measurements and corrects for this effect.
The Archie and Waxman-Smits models share four important parameters. These are Rw, Rt, m, and n. The Rt is measured on a foot-by-foot basis with resistivity logs. On the other hand, the industry does not have a tool to measure the other three parameters on a foot-by-foot basis but uses an average value based on laboratory core analyses.
Equation 3 is the basic equation for calculating the original hydrocarbon in place (OHIP). In the equation, F is porosity, Sw is water saturation, H is the reservoir thickness, and A is the reservoir area.
Porosity is measured with an understandable accuracy and hence will not be included in the error analysis discussed in this article.
For simplicity, this article will only use the Archie equation to discuss the extent of potential errors in reserves calculations. The methodology here analyzes each component separately and assumes that all other components are accurate.
True formation resistivity
Resistivity tools measure formation resistivity on a foot-by-foot basis. Many in industry are concerned that this resistivity measurement may be inaccurate because of the effect of formation bedding, tool centralization, mud type, mud invasion, etc. For these reasons, some companies spend much money and expend considerable effort in correcting the measured resistivity to obtain a true formation resistivity
To obtain what is called true formation resistivity, Rt, companies have developed many simulators to correct the measured resistivity. But our research has found that the accuracy of Rt is important but not the major factor that propagates errors in reserves calculations. We believe that the amount of effort and money spent to obtain the true formation resistivity would be better spent on other saturation parameters that have more effect on water saturation calculations and hence hydrocarbon reserves.
Also, obtaining the true formation resistivity requires many assumptions in the simulators, thus raising questions about the validity of the calculated values.
True formation resistivity
Our error analysis used the Archie model to examine the effect of an erroneous true formation resistivity on water saturation calculations (Equations 4-7). In the equations, Rte is the erroneous true formation resistivity and Rtc is the correct true formation resistivity.
Fig. 1a shows the expected error in saturation due to an erroneous Rt for various n values. This calculation assumes that the true formation resistivity is 30 ohms and that an error of up to ±10% has been introduced.
This 10% error in formation resistivity introduces a maximum 7% error in water saturation for a wide 1.5-2.2 range in the saturation exponent n.
Cementation exponent
Our cementation-exponent error analysis includes the widely used value of 2 for m and also introduced a ±10% error, similar to the analysis of Rt (Equations 7-9). Equation 9 shows that the error of m depends on formation porosity and the saturation exponent.
The analysis results (Fig. 1b) for a formation with a low porosity of 10 porosity units and an n ranging between 1.5-2.2 indicates that a ±10% error in m can produce up to 35% error in water saturation. This conclusion shows the importance of using an accurate m value and the danger of using a single value across the reservoir.
For a formation with a higher porosity, 20 porosity units and the same values for n, the analysis (Fig. 1c) indicates that the error caused by m decreases as formation porosity increases, although an inaccurate m still represents a higher source of error when compared with Rt.
Saturation exponent
Our analysis uses the same methodology to determine the error in water saturation caused by an error in the saturation exponent n (Equations 10-12).
Equation 12 is complicated and requires the analysis of multiple cases. Two are discussed in this article and readers can generate the rest depending on the properties in their reservoirs.
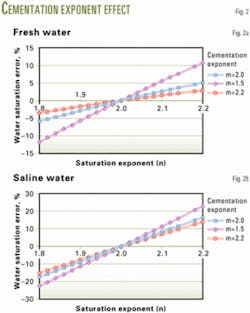
The two cases illustrated use cementation factors of 1.5, 2, and 2.2 and a true formation resistivity of 30 ohms
Fig. 2a shows the error in water saturation in the case of a low 10 porosity unit formation with fresh 0.1-ohm water, while Fig. 2b shows the error in the same low 10 porosity unit formation but with saline 0.01-ohm water.
These analyses clearly indicate that the error on water saturation can approach 25%, depending on the salinity of the formation water and a formation with an m equal to 1.5, which probably represents the case for a fractured rock with secondary porosity.
Formation water resistivity
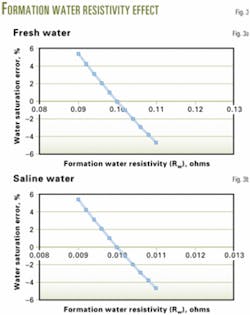
The error analyses of formation water resistivity is similar to that for true formation resistivity (Equations 13-15).
The analyses (Figs. 3a and 3b) use a true formation resistivity of 30 ohms for two cases. One case is for a formation with fresh 0.1-ohm water and the other one is for a formation with saline 0.01-ohm water.
Sw error effect on reserves
As seen in these analyses, the cementation exponent and the saturation exponent can produce up to 35% errors in water saturation values. Such errors will propagate to the reserves calculations and uncertainty can approach 70%.
This is illustrated by introducing a 20% error in the water saturation value in the reserves equation (Equation 3). This error results in greater than a 50% error in reserves for formations having a 60% actual water saturation (Fig. 4).
In good reservoirs with water saturation less than 20%, the error could be as great as 20%.
The analyses presented show clearly that the most important parameter in the saturation calculations is the cementation exponent m, followed by the saturation exponent n. The Rt and Rw are also important in the water saturation calculations but they do not introduce the same amount of error as m or n.
It is important to note that this article discusses the effects of errors in the correct measured values of all parameters but if someone chose the incorrect value of m, n, or Rw , this wuld be considered a mistake, not an error.
References
1. Oraby, Mustafa, "A Lithology Independent Porosity Model Using Three Neutron Measurements, Part II-Applications and Error Analysis," Paper No. SPE 26435, 68th SPE Annual Technical Conference and Exhibition of the Society of Petroleum Engineers, Houston, Oct. 3-6, 1993.
2. Oraby, Moustafa, et al., "A new Method for Gas Saturation Calculations and Its Applications in Prudhoe Bay," SPWLA 36th Annual Logging Symposium, Paris, June 26-29, 1995.
The author
Moustafa Oraby [email protected] is the technology manager for Halliburton Energy Services, in Cairo, Egypt. He previously worked for both oil companies and service companies in many areas of the world, specializing in formation evaluation. Oraby has a BS and an MS in physics from Alexandria University, and a PhD from North Carolina State University in logging tools' modeling using Monte Carlo technique.


