Simulation reveals conditions for onshore arctic gas-condensate pipeline
Simulation of a long distance, large-diameter multiphase pipeline through onshore arctic conditions evaluated the effects of steady-state and transient conditions. The hypothetical pipeline contained a single intermediate compressor station.
The study considered both base and rich-gas compositions, under such transient conditions as rate changes, pigging, and shut-in and restart and used the multiphase transient simulator OLGA2000.
For high steady-state flow rates, substantial Joule-Thomson cooling was observed. In addition, for both rate-change and pigging simulations, either large slug-catcher surge volumes or high slug-catcher drain rates were required.
Unless rate changes were carried out very slowly, increases in flow rate were found to produce more-demanding conditions for the slug catchers than pigging, if separator drain rates were limited. With the more-abrupt arrival of pigging slugs, however, increasing the separator's drain rate was much less effective in reducing pigging surge-volume requirements than for the corresponding requirements of rate changes.
Shut-in and restart operations generated substantially smaller surge-volume requirements than either pigging or rate changes.
Reducing facilities
One of the greatest challenges in gas developments in remote arctic locations is the transport of gas to market over long distances. Options for overland transport include single-phase gas pipelines, high pressure, dense-phase gas pipelines, or multiphase gas-condensate pipelines.
One of the advantages of the gas-condensate option is the avoidance of extensive gas conditioning facilities at a remote site. In addition, a more conventional gas-condensate pipeline may avoid the large pipe wall thickness associated with a high pressure, dense- phase pipeline.
On the other hand, large slug catchers may be required to handle the liquid slugs generated by transient operations of the pipeline, including rate changes and pigging.
The hypothetical study evaluated the feasibility of a multiphase gas-condensate pipeline for long distance overland transport of gas from an arctic field. A generic pipeline was envisioned for transporting gas and condensate about 300 km from an arctic field to a receiving facility.
The nominal peak flow rate of this pipeline is 1,200 MMscfd, although reduced throughputs of 600 or even 200 MMscfd are possible. In addition, the desirable delivery pressure of the gas to the pipeline is 1,667 psia, even though gas may be gathered at as much as 2,500 psia behind the pipeline.
Simulations also included an intermediate compressor station near its mid point. This compressor has a suction pressure of 1,667 psia. An after cooler also cools the gas leaving the compressor to 21.0° C.
The combination of small available pressure drop for such a long pipeline with the desire for a turndown ratio as high as six makes the design of this pipeline particularly difficult. In addition, the sheer size of the pipeline tends to make slug-catcher surge volumes very high, even for modest liquid loadings of a plausible gas.
Evaluation of a slug catcher's size can be performed only through transient analysis because it is the transient operations such as rate change, pigging, and shut-in and restart that generate the large slug catcher size requirements.
Procedure
A large-diameter pipe reduces the required pressure drop at high flow rates at the expense of higher liquid inventory. This higher inventory is reflected in larger slug catcher sizes needed for rate change and pigging operations.
Conversely, smaller-diameter pipes increase pressure drop but reduce liquid inventory, particularly at lower flow rates. In addition, an intermediate compressor station can be used to compensate for high pressure drops at high flow rates.
In order to balance pressure drop and liquid inventory concerns, the study used a nominal 28-in. pipeline with one intermediate compressor station.
The simulations on OLGA2000 v3 used both steady-state simulations and transient simulations.1 2 Transient simulations performed include rate change, pigging, and shut-in, and restart cases.
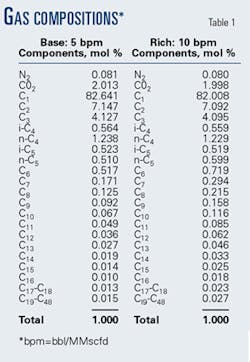
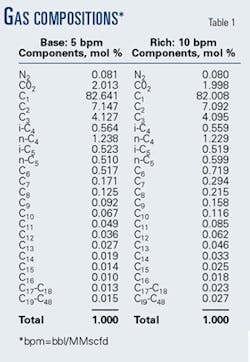
OLGA accesses fluid properties through an externally generated set of tables containing relevant thermodynamic and rate properties as a function of pressure and temperature. These PVT tables were prepared with PVTsim v12.04 based on plausible fluid compositions. Both a base-case composition with a liquid loading of about 5 stock tank bbl/MMscfd (bpm) and a rich-case composition having a liquid loading of about 10 bpm were considered.
Table 1 gives the compositions.
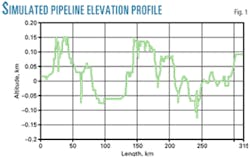
The flowline geometry has an elevation profile of flat to moderately hilly terrain. The length of the pipeline is 313.8 km. The pipeline wall roughness is 0.000015 m. The pipeline has a 679.45-mm ID with a 15.87-mm WT. Fig. 1 shows the flowline geometry.
The pipeline is buried under 1.55 m of average equivalent soil with a density of 2,000 kg/cu m, a thermal conductivity of 1.152 w/m K., and a thermal capacitance of 1019.92 Joules/kg K.
In this model, OLGA assumes that all wall layers are radially symmetrical around the pipe and employed a plausible arctic ambient temperature for winter or early spring conditions. This could be modeled even more accurately with asymmetric models, including permafrost or other effects as needed. The inlet ambient temperature is 212° C.; the outlet temperature is 21° C. The ambient temperature was linearly interpolated along the pipeline.
The steady-state simulations were carried out at six different flow rates: 200, 400, 600, 800, 1,000, and 1,200 MMscfd for both the rich and base-gas compositions. Rate-change cases started from 600, 800, and 1,000 MMscfd and ended at 1,200 MMscfd for the base gas and from 600 to 1,200 MMscfd for the rich gas.
Pigging simulations were carried out at 600 and 1,200 MMscfd. Shut-in and restart simulations were performed for both the base and the rich gas at 600 MMscfd. Prior to abrupt restart, the pipeline was shut in for 12 hr.
Even though the liquid efflux rate from the pipeline into the slug catcher is a strong determinant of the slug-catcher surge volume requirement, the liquid drain rate from the slug catcher also affects the volume required. There is always a trade-off between surge volume and peak drain rate. Indeed, for a sufficiently high slug-catcher drain rate, all the slugs pass through the slug catcher and no surge volume whatsoever is required.
A desire to quantify this drain rate—surge volume tradeoff led to the performance of post-processing of the OLGA results. A constant drain rate is subtracted from the instantaneous liquid influx rate to determine the instantaneous liquid accumulation rate. This rate is integrated over the duration of the incident studied to determine the liquid volume in the slug catcher. The peak volume of this liquid accumulation is the surge-volume requirement for the OLGA case and drain rate considered.
For the same base simulation, a number of drain rates can be considered and the surge-volume requirement plotted as a function of the drain rate. The resulting plot is useful for determining the relative effects of slug catcher size and liquids handling capacity. This approach assumes the slug catcher's drain rate does not affect the flowline dynamic behavior.
Steady state, rate-change results
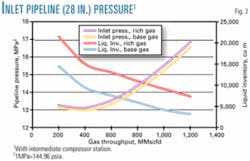
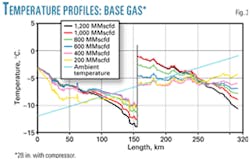
The steady-state pressure drop results are summarized in a plot of inlet pressure and liquid inventory as a function of flow rate. Fig. 2 shows plots for both base and rich gases. Fig. 3 presents a composite plot of temperature profiles for a variety of flow rates.
Increasing flow rates decrease pipeline liquid inventory, while increased liquid loading increases liquid inventory. Inlet pressure goes through a minimum pressure value at an intermediate flow rate.
Decreases in gas velocity below this minimum increase the hydrostatic pressure drop in the liquid-loaded uphill sections. Comparison of gas temperature to surroundings temperature shows substantial Joule-Thomson cooling at the higher flow rates.
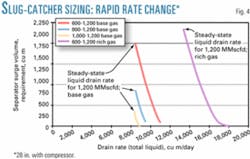
Simulations for a range of initial flow rates increased them abruptly to 1,200 MMscfd. In addition, to determine the effect of more gradual increases in inlet flow rate led to simulations for rate changes from 600 MMscfd to 1,200 MMscfd linearly ramped over a range of durations. Fig. 4 shows the results of the drain-rate analysis for both base and rich gas.
As a result, surge-volume requirements were as high as about 2,000 cu m for the base gas and about 2,400 cu m for the rich gas to accommodate the liquids resulting from a rapid rate change of from 600 to 1,200 MMscfd. Increases in drain rate can substantially reduce these requirements, although it can be seen that 20-30% increases in the liquid-handling capacity is required to effect this reduction. These still represent potentially large slug catchers.
It should be emphasized that these simulations include no effects of the dynamics of the intermediate compressor or the buffering effects of the slug catcher associated with this compressor. All liquids are immediately passed through the compressor. In reality, liquid storage in the intermediate-stage slug catcher would mitigate the severity of the rate-change slugs.
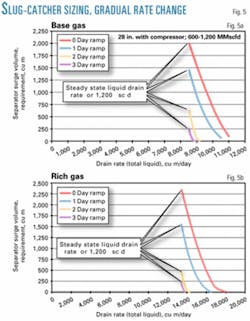
The instantaneous inlet-rate change scenarios shown in Fig. 4 represent very severe transients. In order to determine whether a more gradual rate change could result in small surge-volume requirements, OLGA simulations were performed in which the inlet rate change was linearly ramped-up from 600 to 1,200 MMscfd over 1, 2, and 3 days.
For each of these ramp rates, both base and rich gases were considered. While liquid inventories and liquid efflux rates are somewhat higher for rich gas than base gas, the same trends observed for the base gas recur. The two graphs of Fig. 5 summarize the slug-catcher sizing calculations for the 1,200 MMscfd and the 600 MMscfd cases, respectively.
The fluid parcel's travel time for 1,200 MMscfd (pipeline length divided by mixture velocity) is about 1 day.
These summary plots show that, in order to reduce significantly the slug catcher's surge-volume requirements below that predicted by an instantaneous rate change, it is necessary that:
- Liquid handling capability sufficiently exceed the steady-state liquid handling requirement at the final flow rate.
- A linear ramp time for the inlet flow be two or three times the fluid parcel's transit time.
For these conditions, slower rate changes can reduce slug catcher surge-volume requirements to much more manageable sizes.
Pigging results
Pigging simulations were run for 1,200 and 600 MMscfd for both the base and the rich gas compositions. A single pig was inserted into the pipeline and sent through the compressor station to the outlet. Only one pig was in the pipeline at a time.
The modeled pigging scenario may not be very realistic in that the pig is running straight through the compressor station. In actual operations, the pig must be trapped in front of the compressor station and reinserted downstream of it. The size of the pigging slug arriving at the outlet of the pipeline will depend on the liquid take-off rate from the separator at the intermediate station.
There are several operational pigging scenarios that apply for reducing the size of the pigging slug estimated in this section. For instance, the flow rate can be ramped up before a pigging operation to blow out some of the liquid in the pipeline. Pig surge-volume calculations indicate the size of the pigging slug arriving both at the outlet and at the intermediate compressor station.
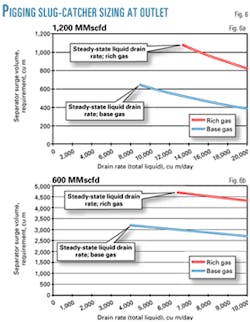
Fig. 6a shows the results of the drain rate post-processing analysis for the 1,200-MMscfd pigging simulation run. The plot shows that the size of the pigging slug at the outlet is about 1,100 cu m (7,000 bbl) for the rich gas and 650 cu m (4,000 bbl) for the base gas at a steady-state drain rate. The pig traverses the pipeline in a little less than 21 hr, and liquid builds up within about 10 hr following pig arrival.
The entire pigging slug arrives in less than 1 hr. As seen from Fig. 6a, draining faster than the steady-state drain rate has little effect because the slugs arrive so fast. In addition, the short liquid rebuild time means that pigs would have to be launched at shorter intervals than 10 hr to reduce the pigging slug size.
Fig. 6b shows the results of the corresponding drain rate post-processing analysis for the 600-MMscfd pigging simulation runs. At the flow rate of 600 MMscfd, the size of the pigging slug is 4,700 cu m (30,000 bbl) for the rich gas and 3,100 cu m (20,000 bbl) for the base gas, dramatically larger than for the corresponding 1,200-MMscfd pigging runs.
The pig traverses the pipeline in about 37 hr, and liquid builds up to its equilibrium level within about 17 and 22 hr, respectively, following pig arrival for the base and rich gases.
In an actual pigging operation, the pig would be caught immediately upstream of the intermediate compressor station and the pigging liquid slugs might be held in a slug catcher at that point rather than immediately reinjected into the pipeline downstream of the compressor.
To evaluate the surge-volume requirements of this intermediate slug catcher, the same analysis performed for pig arrival at the outlet was also performed for pig arrival at the intermediate station.
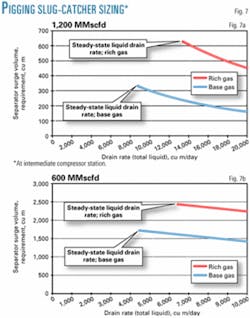
Figs. 7a and 7b, respectively, show the results of these simulations for pigging at both 1,200 and 600 MMscfd. Of course, any liquid retained in the intermediate slug catcher would reduce the surge-volume requirements of the outlet slug catcher shown in Fig. 6.
As a result, a tradeoff between the surge-volume capacities of the intermediate and outlet slug catchers could be made, subject to the constraint that the sum of their surge-volume capacities would be approximately equal to those shown in Fig. 6.
Shut-in, restart results
In the simulation, the pipeline was shut down from steady state at a flow rate of 600 MMscfd and remained closed for 12 hr. The flow was then restarted abruptly to 600 MMscfd.
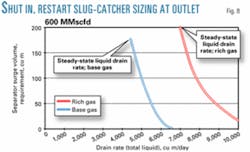
Fig. 8 shows the surge-volume requirements as a function of drain rate for both the rich and the base gas. As seen in Fig. 8, restart results in smaller surge-volume requirements at the outlet than generated by either the rate change or pigging simulations.
The peak liquid surge-volume requirements, resulting from a steady-state separator drain rate during the restart, are about 175 cu m for the base gas and 200 cu m for the rich gas. This illustrates that the slugs obtained after a restart are not crucial when determining the slug-catcher requirements.
Furthermore, modest increments of drain rate in excess of the steady-state requirements are quite effective in reducing surge-volume requirements.
Conclusions
The several simulations performed to determine a number of features of the hypothetical onshore gas condensate pipeline led to several conclusions:
1. Substantial Joule-Thomson cooling exists for the high flow rates. Gas leaves the pipeline at the outlet about 9° C. cooler than the ambient temperature, resulting in arrival temperatures as low as 214° C.
2. The inlet pressure is 2,392-2,450 psia for the 1,200-MMscfd flow rate. This is slightly below the available pressure of 2,500 psia. Due to uncertainty in actual conditions, supply-pressure availability could be a problem for the 1,200-MMscfd case.
3. Slugs for a 600-1,200 MMscfd rate change can still result in very large slug catchers. Slug catcher surge-volume requirements of about 2,000 cu m can be required for the base gas and 2,000 cu m required for the rich gas if separator liquid drain rates are limited to the steady-state values: about 8,400 cu m/day and 13,500 cu m/day for the base and rich gas, respectively.
4. Increases of drain-rate capacity over the steady-state value can significantly reduce slug catcher surge-volume requirements, although 20-30% increases in the liquids-handling capacity at the outlet are necessary to effect this reduction.
5. Slug-catcher size can be further reduced by a gradual ramp-up of the inlet flow during rate changes. To reduce significantly the slug catcher's surge-volume requirements to less than predicted by an instantaneous rate change, however, it is not only necessary to have liquids-handling capability of 20-30% more than the steady state liquids-handling requirement at the final flow rate, but also the linear ramp time for the inlet flow must be 2-3 times the fluid parcel's transit time.
6. For a 1,200-MMscfd flow, the size of the pigging slug is about 1,100 cu m for the rich gas and 650 cu m for the base gas at steady-state drain rate. The pig traverses the pipeline in slightly less than 21 hr. Following pigging, liquid builds up to equilibrium within about 10 hr.
7. At a flow rate of 600 MMscfd, the size of the pigging slug is 4,700 cu m for the rich gas and 3,100 cu m for the base gas. The pig moves through the pipeline in about 37 hr, and liquid rebuilds in 17 hr for the rich gas and in 22 hr for the base gas.
8. Increased drain rate is relatively ineffective in reducing surge-volume requirements for pigging slugs.
9. Liquid surges following a restart are less than 175 cu m for the base gas and slightly larger than 200 cu m for the rich gas. Slugs obtained after restarts are significantly smaller than the rate-change slugs and are not crucial when determining the slug-catcher requirement.
The greatest difficulty in the application of multiphase flow to large gas-condensate pipelines is the potentially large surge volume required for the slug catchers. The largest finger-type slug catchers currently in existence onshore have total volumes in the 4,000 cu m range. Design and operational care must be exercised to prevent the requirement of an overly expensive slug catcher.
The insertion of an intermediate compressor station adds additional complexity to the system. In this study, all liquids were assumed immediately to go "through" the intermediate compressor. In reality, a separator of some sort is necessary at the compressor station merely to protect the compressor from liquids ingestion.
A very large pump draining this separator and re-injecting the liquids into the pipeline downstream of the compressor could reduce the surge-volume requirements of this compressor-protecting separator.
References
1. Bendiksen, K.H., Malnes, D., Moe, R., and Nuland, S., "The Dynamic Two-fluid Model OLGA: Theory and Application," SPE Production Engineering, May 1992, pp. 171-180.
2. Nossen, J., Shea, R., and Rasmussen, J., "New Developments in Flow Modelling and Field Data Verification," Second North American Conference On Multiphase Technology, Banff, June 21-23, 2000.
The authors
H. Lee Norris III is a principal consultant in dynamics and flow analyses for Scandpower Petroleum Technology Inc., Houston, which he joined in 1996. Previously, he has worked as a senior research specialist for Exxon Production Research Co. and an engineering specialist for Becthel Corp. Norris holds a BSc (1970) from the University of Texas and an MSc (1971) and PhD (1975) from Stanford University, all in mechanical engineering.
Allan Rydahl is vice-president of and manager for multiphase marketing and sales (Americas) at Scandpower Petroleum Technology Inc., Houston. He has also served as president of Calsep Inc., Houston. He holds an MSc (1994) in chemical engineering from the Technical University of Denmark and is a member of SPE.
