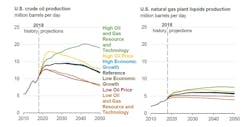
The US will position itself as a net energy exporter in 2020 and will remain so throughout a projection period to 2050 resulting from large increases in production of crude oil, natural gas, and natural gas plant liquids (NGPL) coupled with slow growth in energy consumption, according to the US Energy Information Administration’s Annual Energy Outlook 2019.
In the AEO’s reference case, the US becomes a net exporter of petroleum liquids after 2020 as US crude oil production increases and domestic consumption of petroleum products decreases. Near the end of the projection period, the US returns to becoming a net importer of petroleum and other liquids on an energy basis because of an increase in gasoline consumption and falling crude oil production in those years.
The US became a net exporter of natural gas on an annual basis in 2017 and continued to export more gas than it imported in 2018. In the AEO’s reference case, US natural gas trade—which includes shipments by pipeline to and from Canada and to Mexico as well as exports of LNG—will be increasingly dominated by LNG exports to more distant destinations.
Oil
In the AEO’s reference case, US crude oil production continues to increase through 2030 and then plateaus at more than 14 million b/d until 2040.
With continuing development of tight oil and shale gas resources, NGPL production reaches the 6 million-b/d mark by 2030, a 38% increase from the 2018 level.
Lower 48 onshore tight oil development continues to be the main driver of total US crude oil production, accounting for about 68% of cumulative domestic production in the reference case during the projection period.
US crude oil production levels off at about 14 million b/d through 2040 in the reference case as tight oil development moves into less productive areas and well productivity declines.
In the reference case, oil and gas resource discoveries in the deepwater Gulf of Mexico lead the Lower 48 states’ offshore production to reach a record 2.4 million b/d in 2022. Many of these discoveries resulted from exploration when oil prices were higher than $100/bbl before the oil price collapse in 2015 and are being developed as oil prices rise. Offshore production then declines through 2035 before flattening through 2050 due to new discoveries offsetting declines in legacy fields.
Alaska crude oil production increases through 2030, driven primarily by the development of fields in the National Petroleum Reserve–Alaska, and after 2030, the development of fields in the 1002 Section of the Arctic National Wildlife Refuge. Exploration and development of fields in ANWR is not economical in the AEO’s low oil price case.
Natural gas
The percentage of dry gas production from oil formations increased to 17% in 2018 from 8% in 2013 and remains near this percentage through 2050 in the reference case.
Growth in drilling in the US Southwest, particularly in the Wolfcamp formation in the Permian basin, is the main driver for gas production growth from tight oil formations.
Gas prices remain comparatively low during the projection period compared with historical prices, leading to increased use of this fuel across end-use sectors and increased LNG exports.
In the reference case, US LNG exports and pipeline exports to Canada and to Mexico increase until 2030 and then flatten through 2050 as relatively low, stable gas prices make US gas competitive in North American and global markets.
After LNG export facilities currently under construction are completed by 2022, US LNG export capacity increases further. Asian demand growth allows US gas to remain competitive there. After 2030, US LNG is no longer as competitive because additional suppliers enter the global LNG market, reducing LNG prices and making additional US LNG export capacity uneconomic.
Increasing gas exports to Mexico are a result of more pipeline infrastructure to and within Mexico, resulting in increased gas-fired power generation. By 2030, Mexican domestic gas production begins to displace US exports.
As Canadian gas faces competition from relatively low-cost US gas, US imports of gas from Western Canada continue to decline from historical levels. US gas exports to Eastern Canada continue to increase because of its proximity to US gas resources in the Marcellus and Utica plays and because of recent additions to pipeline infrastructure.

