Global, US oil use to climb in 2013 as economies continue to struggle
Conglin Xu
Senior Editor-Economics
Laura Bell
Statistics Editor
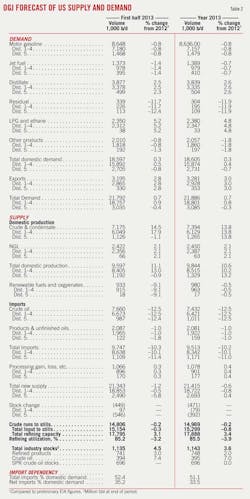
Demand for oil and gas in the US will climb this year, bolstered by improving economic conditions. US crude oil and lease condensate production is expected to rise 13.8% to 7.4 million b/d in 2013. The rise in production will more than offset the increase in demand, pushing imports down.
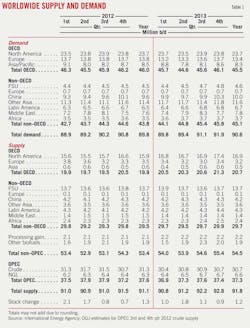
Worldwide oil demand will grow 0.9%, and global oil supply will climb 0.8%. Demand from China will post the largest increase. North American members of the Organization for Economic Cooperation and Development—Canada, Mexico, and the US—will contribute most of the output growth. Oil supply from members of the Organization of Petroleum Exporting Countries will slip to an average 37.3 million b/d this year from 37.6 million b/d last year.
World economic outlook
World economic growth is forecast at 3.3% for 2013, according to the World Economic Outlook (WEO) issued in April by the International Monetary Fund. The WEO update in January forecast growth of 3.5%.
The World Bank, in its most recent Global Economic Prospects issued in June, projected global growth for 2013 at 2.2%, compared to 2.3% in 2012. The bank, in its January forecast, had expected a 2.4% growth rate.
The IMF estimates US growth in gross domestic product (GDP) in 2013 at 1.9%, based on improvements in housing and labor markets. Amid ongoing stimulus efforts, Japan is forecast to grow at 1.6%, compared with 2.0% last year and a contraction of 0.6% 2 years ago. The economy of Euro Area remains subdued with a 0.3% decline in 2013.
Among emerging economies, China is experiencing a slowdown. In its April WEO, the IMF lowered its estimate of Chinese economic growth for 2013 to 7.75% from 8.0% in the January WEO. In addition, the HSBC/Markit Chinese Manufacturing PMI index fell into "contracting" territory in May.
Worldwide oil demand
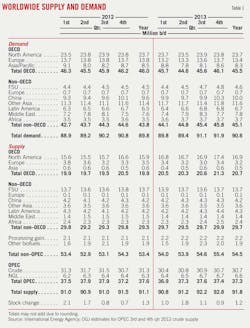
Global oil demand this year will average 90.6 million b/d, compared with 89.8 million b/d last year, according to the June projection by the International Energy Agency. Worldwide demand averaged 89.6 million b/d during the first half of 2013 vs. 89.1 million b/d in the same period of last year.
Oil demand growth for 2013 so far has been suppressed by global economic sluggishness. In the second half of the year, slightly higher demand is expected primarily due to the seasonal structural adjustments and recovery in parts of the world.
The Euro zone is expected to experience a deeper contraction. Several European economies have slipped back into recession in recent months. Consumption declines in many of the OECD countries have been larger than expected. OECD demand averaged 45.2 million b/d in the first half, down from 45.9 million b/d last year.
Total oil consumption in countries outside the OECD is forecast to average 44.45 million b/d for the first half and 45.1 million b/d for the year, according to IEA. Among non-OECD members, China will post the largest demand growth. Chinese oil demand will climb to average 10 million b/d in 2013, up 4% from 2012. The forecast of China's oil demand growth, however, also has been trimmed by IEA as a result of subdued Chinese economic indicators. Average demand in the Former Soviet Union is to rise by 100,000 b/d this year to 4.6 million b/d.
Global oil supply
Worldwide oil supply will average 91.8 million b/d this year, up from 91.1 million b/d last year, led by an increase in OECD America and non-OECD output. IEA expects total OECD crude oil supply to be up 800,000 b/d in 2013 at 20.7 million b/d.
Crude oil supply in OECD America—which includes the North American OECD countries and Chile, where production is negligible—will increase 6.3% to 16.9 million b/d this year. Non-OECD output will average 29.7 million b/d, compared with 29.5 million b/d in 2012. Output is expected to be little changed from last year in the FSU, Europe, China, and other Asia. Total oil supply from non-OPEC countries is forecast to be 54.5 million b/d this year, compared with 53.4 million b/d last year.
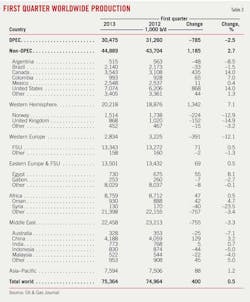
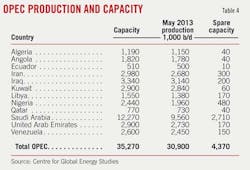
OGJ forecasts that total oil supply from OPEC, including 6.6 million b/d of natural gas liquids, will average 37.3 million b/d, compared with 37.6 million b/d last year. OPEC crude production in the first quarter 2013 declined by 900,000 b/d from the first quarter 2012, averaging 30.4 million b/d. OPEC crude production rose to its highest level in 7 months in May at 30.57 million b/d, due to increased output from Saudi Arabia, Iran, the UAE, and Kuwait.
US economy
The US economy continues to recover despite some weaker-than-expected signals in recent economic indications. OGJ assumes US real GDP growth of 2.5% in 2013.
Following a 5.9% March decrease, new orders of manufactured durable goods increased 3.3% to $222.6 billion in April, the US Census Bureau reported. Real GDP increased at an annual rate of 2.5% in the first quarter of 2013, below the expectations of many forecasters, according to the US Bureau of Economic Analysis.
House prices and construction activity have rebounded. The S&P/Case-Shiller Home Price Indices in the first quarter of 2013 posted double-digit annual increases.
The Conference Board Consumer Confidence Index continued to improve, standing at 76.2 (1985=100) in May. The index was 69.0 in April and 61.9 in March.
Private fixed investment driven by business equipment and software spending will climb 6.5%, according to economic assumptions of the US Energy Information Administration (EIA).
The most recent labor market report showed a slight increase in the unemployment rate to 7.6%. Nonfarm employment increased considerably in the past months. The share of long-term unemployment declined to its lowest point since November 2009.
Crude and product prices
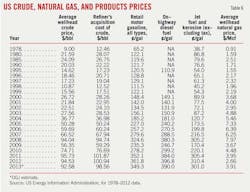
OGJ forecasts that the average US wellhead price of crude this year will be $92.58/bbl, down from $94.53/bbl last year. The average refiner acquisition cost of domestic and imported crude has moved with wellhead prices and is forecast to average $98.56/bbl this year, down from $100.94/bbl last year.
Lower crude costs will cut product prices. OGJ forecasts that the pump price for all types of motor gasoline in the US will average $3.49/gal for 2013, down from $3.61/gal last year. Jet fuel will average $3.01/gal this year vs. $3.10/gal for 2012.
The on-highway diesel fuel price has climbed sharply since 2009, surpassing the pump price of gasoline. OGJ forecasts that the on-highway diesel fuel price will average $3.90/gal, slightly lower than last year.
US energy demand
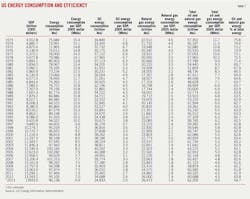
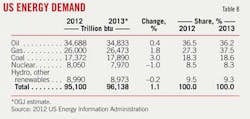
Overall energy demand in the US will rise in 2013 but won't keep up with economic growth because of energy-efficiency improvement. Total US energy consumption will move up 1.1% to 96.1 quadrillion btu (quads) this year from 95.1 quads last year.
Oil energy demand in the US is projected to move up 0.4% in 2013 to 34.83 quads. Oil energy consumption for 2012 was 34.68 quads, down 2.2% from 2011.
Natural gas energy demand will climb 1.8% to 26.47 quads due to colder winter temperatures forecast and increased usage for residential and commercial space heating.
Increased electric power consumption due to higher electricity demand and higher natural gas prices will boost demand for coal energy by 3% in 2013 to 17.89 quads.
Demand for other renewable energy is expected to increase 0.3% in 2013, while hydropower declines by 4.4%.
US products demand
In this year's first half, motor gasoline consumption is estimated to have been 0.8% down from a year earlier, averaging 8.65 million b/d. The vehicle fleet's increasing fuel efficiency offsets gains in motor vehicle travel. For the year motor gasoline demand is projected to average 8.64 million b/d, down 0.8% from 2012.
The US driving season is forecast to boost gasoline demand by 300,000 b/d this summer, according to EIA.
US demand for distillate fuel oil, which includes diesel, during the first half of this year is estimated at 3.87 million b/d, up 2.54% from the same period last year. US consumption of distillate fuels fell 4% in 2012, partly because of a mild winter. For the year OGJ projects distillate demand of 3.84 million b/d, up 2.56% from 2012. Distillate demand found support from expansion of trucking and a consequent increase in diesel use. The trucking sector index was up 4.3% year-over-year in April, according to the American Trucking Association.
Demand for residual fuel oil is forecast to decline 12% this year to average 304,000 b/d. After reaching a peak of over 3 million b/d in the late 1970s, demand for residual fuel oil in US has steadily declined because of its reduced use as a boiler fuel. While resid has been mostly replaced by natural gas in electricity generation, demand for it in other, smaller markets, especially transportation, has changed little.
Demand for liquefied petroleum gases and ethane is projected to average 2.38 million b/d in 2013, up 4.8% from 2012. Demand during the first half was up 5.2% at 2.35 million b/d, largely because of increased chemical consumption.
Jet fuel demand will average 1.39 million b/d this year, nearly flat with the 2012 level. Demand for all other petroleum products, including petroleum coke, lubricants, asphalt, and others, also expected to change little this year.
US oil production
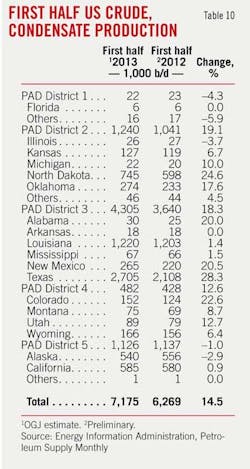
OGJ expects US production of crude oil and lease condensate to rise 13.8% to 7.4 million b/d in 2013 from 6.5 million b/d last year. In the first 6 months of this year, production increased 14.5% from a year earlier to 7.17 million b/d. Production increases in states such as North Dakota, Texas, Louisiana, and Oklahoma offset declines in Alaska, where output fell to 540,000 b/d from 556,000 b/d in the first half of 2012.
Output from tight oil plays, mainly the Permian basin, Eagle Ford, and Bakken shale, is expected to account for most of the annual increase.
EIA, in its latest Short-Term Energy Outlook, predicted that oil production from the US Gulf of Mexico will increase by 130,000 b/d during 2013 and that production from the non-Gulf Lower 48 will increase by 810,000 b/d. The forecast for Gulf of Mexico production growth was trimmed due to maintenance at the BP-operated Pascagoula gas processing plant during May and early June. Alaska oil production is forecast to decrease by 30,000 b/d in 2013, according to EIA. Annual maintenance on the Trans-Alaskan pipeline system reduced Alaskan North Slope supply.
Natural gas liquids production will be up 2.1% this year, averaging 2.45 million, according to OGJ.
Imports, exports
OGJ expects total imports to fall 10% to 9.5 million b/d this year. Crude oil imports will decline 12.5% to 7.4 million b/d, while imports of petroleum products will fall 1% to 2 million b/d.
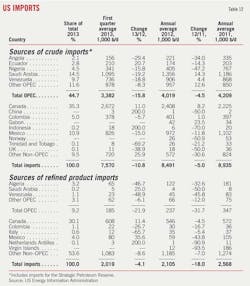
First-quarter average crude imports from Saudi Arabia were 1 million b/d, down 19.2% from the annual average level in 2012. This follows an annual average increase by 170,000 b/d, or 14.3%, in 2012. US imports from Nigeria also were down, replaced by growing supplies of domestically produced light, sweet crude. Total imports from OPEC countries fell 15.8% to 3.3 million b/d in the first quarter of 2013 from average for all of 2012.
Among Non-OPEC countries, Canada remained the premier crude exporter to the US, accounting for 35% of total US crude imports in the first quarter in 2013. In that period, imports from Canada averaged 2.67 million b/d. The annual average of imports from Canada in 2012 was 2.4 million b/d, up 8% from 2011. US crude imports from Mexico and Colombia decreased to 1.2 million b/d in the first quarter this year, 16% of total US imports.
US imports of petroleum products averaged 2 million b/d in the first quarter, down 4% from the 2012 annual average. This follows an annual average decrease of 18% in 2012 to 2.1 million b/d. The leading source of US product imports during 2012 and 2011 was Canada, followed by Algeria, Mexico, and Venezuela.
OGJ forecasts that US exports of crude and products will average 3.28 million b/d this year, up from 3.18 million b/d last year.
In 2012, the US became a net exporter of products for the first time in 62 years, with exports 439,000 b/d higher than imports. The US also became a net exporter of LPG last year for the first time. In its Annual Energy Outlook 2013, EIA projected that the US will remain a net exporter of LPG through 2040 as production of natural gas and oil increase.
Oil inventories
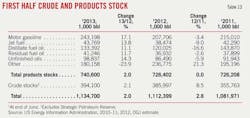
OGJ forecasts that US inventories of crude and products at yearend will be larger than at yearend 2012. At midyear, commercial stocks of crude oil totaled about 394 million bbl. Product inventories will total 748 million bbl at the end of this year, up from 733 million bbl last year.
As refineries return from maintenance, inventories are shifting from crude to products. US gasoline inventories have been rising, especially in Petroleum Administration for Defense (PADD)-1 (the East Coast) and PADD-3 (Gulf Coast). Gasoline stocks in PADD-2 (Midwest) remain below last year's level because of reduced refinery runs and pipeline disruptions.
Distillate inventories continued to rise because of higher production and muted demand growth.
Refining
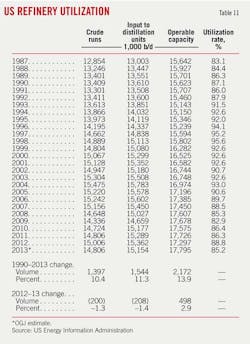
Operable refinery capacity averaged 17.8 million b/d during the first half of 2013 and is expected to remain at about the same level through the remainder of the year. Total inputs will average 14.97 million b/d, down slightly from last year.
With the start of the driving season, refiners in PADD-1 and PADD-3 are operating at more than 90% of capacity, according to OPEC's June Monthly Oil Market Report. In PADD-2 refinery runs remained lower due to maintenance.
US natural gas
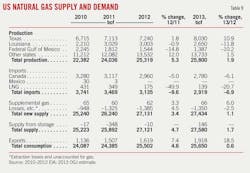
US consumption of natural gas is expected to increase 0.6% in 2013 to 25.65 tcf, according to OGJ. This follows increases of 4.6% in 2012 and 1.2% in 2011.
In recent years, electric power generation has claimed the largest share of gas consumption. However, recent increases in natural gas prices will cut gas use for power generation to 22.5 bcfd in 2013 from 25.0 bcfd in 2012, according to EIA.
Industrial gas use moved up 3% during the first 5 months of 2013 from the same period in 2012. Lower winter temperature forecast in 2013 will boost gas demand for residential and commercial space heating. Other potential sources of additional demand include transportation fuel and expanded chemical production.
Gas exports to Mexico in the past 3 years have doubled, according to a recent research note from Barclays. Barclays expects US exports to Mexico to average 2 bcfd in 2013 and 2.2 bcfd in 2014. Gas imports from Canada will drop to 2.78 tcf from 2.96 tcf in 2012. LNG imports are expected to remain at minimal levels.
US marketed production of natural gas is expected to increase 1.9% to 25.8 tcf in 2013, with increased onshore production and decreased federal Gulf of Mexico production. This follows a 5.3% increase in 2012. Output in Texas will increase 10.9% to 8 tcf this year.
OGJ forecasts that the US wellhead gas price will average $3.9/Mcf this year, up from $2.66/Mcf in 2012.
