North American Resource Value — 2: North American tight oil play economics compared
Barry Rodgers
Rodgers Oil & Gas Consulting
Edmonton
This report is the second of two parts on the economics and fiscal competitiveness of North American tight oil resources.
The purpose of the first part of the report was to establish general context for considering the individual plays and to highlight the importance of the fiscal system in determining investment competitiveness (OGJ, Apr. 1, 2013, p. 46).
This second part is a look at the economics of the individual plays.
Observations from Part 1
Part I provided the estimated ultimate recoveries, technical cost estimates, and fiscal context for assessing in Part 2 the economics of selected North American tight oil plays.
Key observations from Part I are:
1. Fiscal costs in Canada are lower than those in the US. Fiscal cost refers to the share of revenue for resource owners (private land owners and governments). This cost includes bonuses for land acquisition, royalties, state, and federal corporate income taxes, property taxes, and severance taxes.
2. Formation depths in Canada are generally shallower than those in the US. This helps explain the higher US drilling costs.
3. Play sizes in terms of reported EUR per well are generally higher in the US than in Canada.
Technical parameters
Tight oil in this report includes both light and heavy oil and shale oil.
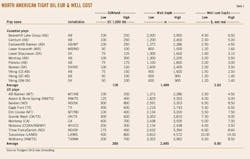
Table 1 identifies the plays with the associated jurisdictions, the representative well depths, the expected ultimate recoveries, and the costs to drill, equip, and tie-in each well.
These parameters are based on publically available sources, most notably operator reports. While they are assumed to be representative of the wells for the operators reporting, more extensive research would be required to establish their likelihood of occurrence and the degree to which they are representative of the entire play.
Oil price is assumed to range from $70 to $100/bbl for West Texas Intermediate. The base case price is $85 with $5 for transportation. No adjustment is made for differences among the plays related to price.
Such adjustments would include consideration of crude quality (e.g., density, sulfur content, viscosity, total acid number), refinery configuration, product yield, transportation constraints and options, and supply and demand in the specific market. These would be incorporated before final investment decisions are made; however, they are beyond the scope of analysis for this article.
The well costs for the US are shown to be on average 2.4 times higher than those in Canada. This is related to the deeper wells required in the US.
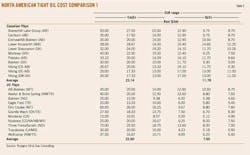
Operating costs (OpEx) are held the same on a per barrel basis between Canada and the US, with adjustments for depth and EUR. Table 2 presents the CapEx on a per barrel basis with the corresponding per barrel OpEx. On a per barrel basis, US and Canadian CapEx are about the same with US OpEx per barrel being 36% lower.
Descriptions of the fiscal systems are not provided in this report. These are contained in World Fiscal Systems for Oil & Gas published jointly in six volumes over the period 2011-13 by Van Meurs Corp., Rodgers Oil & Gas Consulting, and PFC Energy (www.bgrodgers.com)
The criteria employed to judge break-even economics are a rate of return (ROR) of 10% in real-dollar terms, net present value of zero when discounted at 10% real (NPV10), and a zero discounted profit to investment ratio (PIR10).
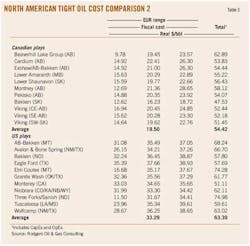
Table 3 presents the fiscal costs, and the total cost with CapEx and OpEx included, expressed in dollars per barrel. While the traditional way of reporting government share is a percentage of operating income (revenue less CapEx and OpEx), the share is also presented here in terms of dollars per barrel. This provides context by facilitating comparison with the CapEx and OpEx values, and with price.
On average, the fiscal costs in Canada are about half (56%) of the combined CapEx-OpEx value. In the US the fiscal cost is about the same or higher (111%) than the CapEx-OpEx value.
For a net back price of $80/bbl, US fiscal costs at $33/bbl are on average $14/bbl higher than those in Canada.
Economics
This section discusses the economics of selected plays.
Due to space limitations, all plays are not discussed in this article. The results for all plays can be found at the website (www.bgrodgers.com). Plays are selected to illustrate three important observations:
1. Fiscal terms can make a significant difference in economic attractiveness;
2. The lower end of the reported EUR range often shows marginal to subeconomic results for many of the plays; and,
3. Competitiveness should not be judged too narrowly.
Fiscal terms
The Alberta Bakken play in Montana is selected to illustrate the impact of fiscal terms.
This play extends across the Canada-US border and is known as the Exshaw in Alberta. Costs, formation depth, and EURs are the same for this play in both jurisdictions. The only difference is the fiscal costs. In Montana a given play can be on either state lands, federal lands, or private lands. Federal and private lands are compared.
For each play the economic indicators are identified for the EUR range and for low and high price and cost sensitivities around the mid-point EUR case. Each case is labeled according to price, cost, and EUR sensitivity; for example, case MP-MC 175 represents the medium (base case) EUR case with medium price and cost conditions and LP-MC 175 represents the base EUR with medium costs and low prices.
Table 4 shows the base case rate of return representing the AB-Bakken play on private land in Montana to be 17.26%. The same play on federal lands (Table 5) would see the ROR increase to 19.44%. This increase is due to lower royalties on federal lands. Note that the low EUR case would be considered uneconomic for the modeled price and cost conditions—more on this later.
Table 6 presents the same play but this time on the Alberta side of the border. The impact of Alberta's generally lower and less front-end-loaded royalty structure is apparent, with the base case rate of return increasing from 17.26% to 27.16%. In Alberta the low EUR case is now shown to be marginally economic with a 9.55% ROR. This reflects government policy to adjust the royalty rate to generally match the economic attractiveness of the project. Tables 7 and 8 present the economic results for the Bakken play.
The first observation to note is significantly higher well costs and EURs for the North Dakota Bakken (Table 8). With healthy values for ROR and other decision-making criteria established, investors will then turn to real-dollar net cash flow (NCF) to determine economic attractiveness.
The North Dakota Bakken NCF at $4.8-21.7 million compared to $2.6-7.5 million for Saskatchewan shows that the North Dakota Bakken yields almost 2 to 3 times more cash flow than the smaller Saskatchewan play.
The attractiveness of the North Dakota Bakken is even more impressive when it is realized that the government share is 61% compared with 32% in Saskatchewan. In both jurisdictions the play economics look very strong. Saskatchewan's government share incorporates a reduced royalty rate similar to that in Alberta to incentivize horizontal wells. The North Dakota extraction tax is similarly reduced.
The next plays compared are Eagle Ford in South Texas and Monterey in Southern California.
Eagle Ford is referred to as a "transition" play as it transitions from gas to oil in a generally southeast to northwest direction. Only the oil is modeled for this article.
The well costs are substantially the same with the EURs for Monterey being 16% to 33% higher, depending on the case.
The ROR range of 17.31% to 46.41% for the Eagle Ford improves considerably for the Monterey play where the ROR range is 36.18% to 70.41%.
This improvement is due to the increased EURs but also to the lower government share in California. California has lower royalties, does not have a severance tax, and the property tax rate is limited to 1%. These differences result in a 54% government share for California compared to 62% for Texas.
The final two comparators are Colorado's Niobrara and Alberta's Cardium. These plays have comparable EURs, however Niobrara costs are higher at $5 million/well compared to $3.5 million for the Cardium play.
The lower well costs help give the Cardium a sharply higher base case ROR of 33.89% compared to 18.72% for Niobrara. The Cardium is also aided by the lower 42% government share in Alberta compared to 64% in Colorado.
The impact of lower fiscal costs in Canada can be seen by comparing the MP-MC 200 Niobrara case with the Cardium MP-MC 200 case. For the same EUR, Cardium's net cash flow to the investor is $6.1 million compared to $2.8 million for the Niobrara case. With OpEx for both cases at about $2 million, the NCF difference is explained by lower well costs ($1.5 million) and lower government share ($1.9 million).
Marginal results
Many of the low case EURs show marginal to subeconomic results even though the base case and high EUR cases are very attractive.
This can be seen by comparing the ROR and NPV10 results for the AB-Bakken/Exshaw plays in Tables 3-5. This is also the case for a number of the other plays; for example, Avalon and Bone Spring, Three Forks/Sanish, and Elm Coulee. This is not surprising and is attributed to companies reporting the minimum EURs that would be economically viable under reasonable price and cost expectations.
In addition, investment attractiveness is very much determined by the targets that investors hope to find or are aiming for. The medium and high EUR cases very much influence investment decisions.
Competitiveness
Competitiveness should not be confused with economic attractiveness.
That an investor can earn a 70% ROR in a Monterey well and "only" a 45% ROR in a Cardium well does not in any practical sense mean that the Cardium is uncompetitive.
This would only be true for the theoretical case where they are the only two plays possible and that there is only one investor with only enough capital to pursue one project. Even in this case the lower ROR project would not be abandoned; it would only have to wait until revenue started to flow from the first project.
What is important in comparing investments is not whether one project has a higher ROR than another but that it has an ROR that is at least equal to the minimum required as determined by the investor's risk-adjusted cost of capital.
The cost of capital, or discount rate, is generally accepted to be 10% for upstream oil and gas ventures. Even here there is evidence that investors would be willing to accept a lower ROR on a larger project (e.g., oil sands) than they would require for smaller projects.
Finally, competitiveness with respect to government share should not be judged too narrowly and should take into account the jurisdiction's resource potential and policy objectives. The WFSOG study previously cited confirmed that exporter jurisdictions with attractive resources tend to apply a higher government share than importer jurisdictions, Canada and the US being notable exceptions.
The higher fiscal shares in the US are explained largely by the influence of private landowners. Private landowners tend to drive a harder bargain with respect to royalties and bonuses as they are not constrained by issues like energy self-sufficiency and job creation that must be the concern of elected governments.
The industry supply sector (drilling rig manufacture, seismic services, etc.) is also a vital consideration. Jurisdictions without a well-developed domestic supply industry tend to focus on high royalties and other fiscal levies as this is their primary means of securing maximum benefits for their resources.
Jurisdictions with a well-developed supply sector would be less concerned with import leakages and thus enjoy more flexibility to secure benefits through a combination of fiscal levies and industry activity. The challenge for policymakers is to secure the "right" balance of direct revenues and job creation without impairing investment competitiveness and economic diversification through increased costs and inflation.
Supply prices
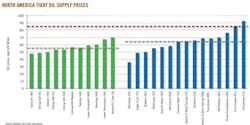
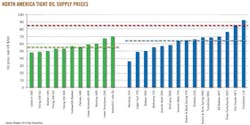
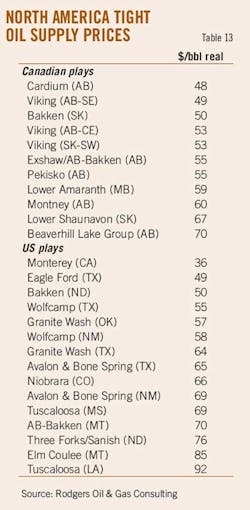
Fig. 1 (with its supporting Table 13) summarizes the North America tight oil play comparison by presenting supply price estimates for each play well.
In instances where a play straddles two jurisdictions the supply price is determined under both sets of fiscal terms. No effort is made to report on the relative resource prospectivity in each jurisdiction.
An important illustration in this context is the Tuscaloosa play in Louisiana and Mississippi. Due to the greatly higher fiscal burden in Louisiana, the breakeven price is raised from $69 to $92/bbl. It is pointed out that this is a new play with significant upside potential and with the prospect for reduced costs as play geology becomes better understood.
The green and blue bars in the figure represent respectively the Canadian plays and the US plays. The dashed green and blue lines represent the average supply prices in each jurisdiction, and the red dashed line provides context by illustrating the modeled WTI price. ficant new supplies of North American crude oil would appear to be secured.
• With a supply cost of $56/bbl, oil sands can compete with tight oil.
• Oil Sands Threat—tight oil however represents a serious threat for Alberta's oil sands:
• The US tight oil supply at 24-30 billion bbl represents 20-25% of Alberta's SAGD oil sands supply.
• Tight oil is mostly light oil. Coupled with their high cost of supply, this means that further expansion of Alberta upgraders to produce synthetic crude oil (SCO) is now even more challenged.
• The oil sands is no longer the only game in town. The largest sources of new tight oil supplies are in the US, the traditional market for the oil sands. The imperative to find new markets for future oil sands production has already been identified.
• Tight oil and oil sands are oversupplying North American markets and helping keep the WTI price at a substantial discount to Brent and other waterborne crudes. This is essentially the same oversupply situation with natural gas. Increased transportation infrastructure will alleviate some of this problem for crude oil, however technologically driven production growth rates that are greater than those of the economy likely mean that a significant Brent to WTI discount will remain. Increased export capacity from North America would certainly help.
• Finally, while producers and jurisdictions currently enjoy a healthy crude price to supply cost margin they should not become too complacent. This is especially true for Canada. Jurisdictions and producers would seem well advised to plan for a time when the full environmental costs will have to be incorporated. The social license to operate may very well demand it.
References
1. Rodgers Oil & Gas Consulting, "The Economics of Alberta's Oil Sands," 2012, and WFSOG previously referenced.
2. US Energy Information Administration, "Review of Emerging Resources: US Shale Gas and Shale Oil Plays," July 2012, and "An Unproved Seven Billion Barrel Oil Resource—The Tuscaloosa Marine Shale," Basin Research Institute, Louisiana State University.
