E&Y: US firms’ capex, revenues, reserves up again in 2014, but cuts loom
US oil and gas companies reported increases across the board in capital expenditures, revenues, and reserves in 2014 as oil prices nearly halved during the second half, according to an annual oil and gas reserves study conducted by Ernst & Young unveiled in Houston on June 3.
The study analyzes US upstream spending and performance data for the past 5 years for the largest 50 companies based on yearend 2014 oil and gas reserves estimates from disclosure information reported to the US Securities and Exchange Commission.
Compared with 2013, revenues increased 10% in 2014 while yearend oil and gas reserves gained 8% and 7%, respectively (OGJ Online, June 24, 2014). A 16% rise in capex in 2014 to $200.2 billion, however, contrasted with a decrease in overall spending during the previous year.
“Total capital expenditures for study companies have more than tripled from 2005 to 2014—even with a big cutback in spending during the 2009 financial crisis,” said Herb Listen, E&Y assurance oil and gas co-leader. “However, due to volatile oil prices in the first quarter of 2015, we have seen US producers significantly reduce capital expenditures at an average of 20 to 25% in recent months.”
John Russell, E&Y assurance oil and gas co-leader, said, “Looking forward to 2015 end-of-year reporting, we expect more impairments, with significantly reduced capital expenditures, revenues, and yearend reserves, if the current commodity prices continue through the end of the year.”
But Russell said the ongoing adjustment by the industry to the depressed price environment will enable companies to continue to make money.
2014 spending, revenues up
The report indicates that overall spending increased in 2014. A significant portion of the growth came from proved and unproved property acquisition costs, each of which increased more than 20% to $27.3 billion and $27.2 billion, respectively.
Development costs, meanwhile, increased 15% to $121.3 billion as exploration costs increased 6% to $23.8 billion, with independents leading the way in both categories. Development costs for independents were up 23% compared with 13% for large independents and 10% for integrated companies. Exploration costs for independents were up 50% while spending by integrated companies and large independents declined.
“Although 2014 capital expenditures did not reflect current low oil prices, US producers have made substantive adjustments to their capital expenditure plans for 2015,” said Russell. “The impact of the reductions in capital expenditures will be evident in our study next year.” He added that most companies this year have limited their spending to operating cash flow.
Revenues increased 10% during 2014, driven by a 9% increase in combined oil and gas production. The top five companies were BP PLC at $16.1 billion, Chevron Corp. at $15.7 billion, ConocoPhillips at $15.5 billion, ExxonMobil Corp. at $15 billion, and Anadarko Petroleum Corp. at $11.9 billion. But rising costs and significant impairments resulted in aftertax profits declining 13% to $28.8 billion.
Impairments totaled $22.9 billion during the year, primarily related to full-cost ceiling test charges for independents that follow the full-cost method of accounting for oil and gas properties and certain properties held for sale, the report says. Listen and Russell noted that only a small handful of the 50 companies studied, such as Apache Corp., Devon Energy Corp., and Chesapeake Energy Corp., use the full-cost system while most use the successful efforts method.
Large independents observed a decline in aftertax profits of 22% while other independents had a decline in aftertax profits of 19%. However, the impact of impairments on integrated companies was less significant as their aftertax profits increased 27%.
“Commodity price declines, particularly in the oil market toward the end of 2014, substantially impacted financial performance for some of the study companies—primarily in the form of impairments stemming from ceiling test charges from full-cost companies and certain properties held for sale,” Listen explained.
“The full-cost ceiling test charge trend is likely to continue during 2015 as evidenced by some substantial impairments reported in the first quarter,” Listen predicted.
‘A different world’
Listen explained that it’s “a much different world now” as prices hover about $60/bbl compared with the beginning of the year when they fell toward $40/bbl. He believes $50-60/bbl oil is “much more attainable” for companies to generate profit, but they need liquidity to survive the weaker months.
“I think over time they will find a way to be profitable in this environment,” he said, adding that drilling and completions costs per well are declining, and cost reductions are compensating for reserves reductions.
Regarding the possibility of mergers and acquisitions during the remainder of the year, Listen thinks there might be “some consolidation” by companies to cut overhead costs. He explained that banks failed to “slam on the breaks” during the initial price drop, and there are lots of buyers but not many sellers. Russell said “there are billions and billions of dollars in private equity waiting on the sidelines” to make purchases.
Listen affirmed that potential sellers aren’t desperate at the moment because they have access to capital.
Large independents’ reserves, production
Large independents led the industry in increased oil and gas reserves and production during 2014. During the 5-year study period, large independents increased their oil production by 88%, oil reserves by 74%, gas production by 31%, and gas reserves by 28%, the study indicates.
Oil and gas production replacement rates, excluding purchases and sales, respectively rose 201% due to extensions and discoveries of 4 billion bbl, and 218% due to extensions and discoveries of 29.1 tcf.
Companies boasting the top 3-year oil production replacement rates, excluding purchases and sales, were Antero Resources Corp. at 2,840%, Consol Energy Inc. at 2,154%, and EQT Corp. at 2,009%. Companies boasting the top 3-year gas production replacement rates, excluding purchases and sales, were Antero at 1,505%, Rex Energy Corp. at 796%, and Continental Resources Inc. at 757%.
Production costs in 2014 averaged $14.09/boe, down from $14.55/boe in the previous year, representing the first decline in the study period. However, total production costs increased 5%. Leaders in 3-year production costs were EQT at $4.43/boe, Southwestern Energy Corp. at $5.76/boe, and Chesapeake at $5.84/boe.
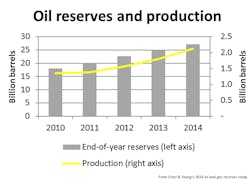
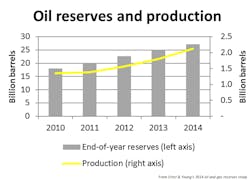
Overall oil reserves for the 50 companies increased 8% to 27.2 billion bbl while oil production jumped 18% to 2.1 billion bbl. Extensions and discoveries fell slightly from 2013 to 4.046 billion bbl, but that total is twice as high compared with 2010. Purchases and sales of oil reserves hit record highs, accounting for a respective 1.4 billion bbl and 833.3 million bbl.
Top companies in reserves in 2014 were ConocoPhillips at 2.3 billion bbl, BP at 2.12 billion bbl, ExxonMobil at 2.11 billion bbl, EOG Resources at 1.6 billion bbl, and Occidental Petroleum Corp. at 1.5 billion bbl.
Yearend gas reserves rose 7% to 190.8 tcf while gas production rose slightly to 13.5 tcf. Purchases of gas reserves accounted for 6.9 tcf while sales of gas reserves were 9.5 tcf. Listen noted companies that are more gas-focused have dealt with low prices for a while and therefore are applying the same principles to oil.
“There are numerous variables that impact reserve estimates, including commodity prices and the related cost of producing as well as multiple geological and geophysical considerations,” Listen explained. “However, we will not be surprised to see some downward reserve revisions at the end of 2015 if oil and gas prices continue at current levels [of around $60/bbl] for the remainder of the year.”
Contact Matt Zborowski at [email protected].

