New NGL-recovery process provides viable alternative
View Article as Single page
Northwest Canada
A second study was recently completed comparing the IPOR process to a straight refrigeration process. Location for this plant is in northwest Canada, an area of existing oil and gas production but no NGL or ethane pipeline infrastructure. Liquids produced in the plant would be trucked to market.
The primary objective of the customer in this application was to deliver a marketable sales gas. Given the current favorable economic climate for gas liquids, however, incremental LPG recovery was of interest if economical.
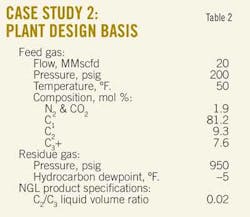
The basis of design of the plant for the study is discussed below. Table 2 summarizes the design basis.
The straight refrigeration process used in the study was a traditional design (Fig. 4), with process temperature selected to achieve the pipeline dewpoint specification, thereby minimizing both CAPEX and OPEX. Propane was used as the refrigerant, with glycol injection used for hydrate inhibition and dehydration. Feed gas for the refrigeration unit was taken downstream of the feed-gas compression, with residue gas sent directly to the sales gas pipeline.
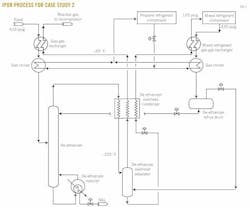
Fig. 5 illustrates the IPOR process used in the study. Feed gas enters the IPOR unit at a compressor interstage pressure of about 410 psig. For this design, the gas-gas exchangers and chillers were conventional shell-and-tube design. All of the noncondensable vapors from the de-ethanizer reflux drum flow to the de-ethanizer overhead separator and on to the residue gas stream.
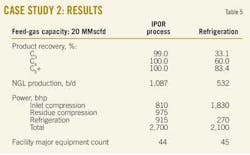
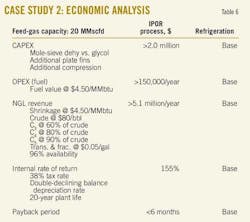
Tables 5 and 6 summarize the study’s results.
From these results, key observations include the following:
1. NGL production with the IPOR unit is more than double that of the refrigeration plant.
2. Complexity of the two designs is comparable, based upon major equipment count, which should result in similar operability and reliability.
(Major equipment count in this case includes the entire plant facility, including dehydration, utilities, and off sites.)
As a result, economics of the IPOR process are once again superior to the refrigeration unit, taking into account incremental differences in both OPEX and CAPEX (Table 6). Estimated capital cost of the IPOR process design was $2 million more than that of the refrigeration plant, the additional cost being the result of:
1. More installed compression.
2. Additional heat-exchanger costs.
3. Additional cost of the molecular-sieve dehydration system vs. the glycol injection system utilized in the refrigeration plant design.
4. More alloy materials.
The operating cost of the IPOR process was estimated to be about $150,000/year more than the refrigeration process. The additional cost was primarily the result of the higher compression power requirements of the IPOR process, and therefore more fuel-gas consumption.
NGL production with the IPOR unit is more than double that of the refrigeration plant. The value of this additional NGL revenue was estimated at $5.1 million/year. Based upon the economic assumptions itemized in Table 6, the calculated internal rate of return of the IPOR plant investment is 155%, with a payback of fewer than 6 months.
Displaying 5/6
View Article as Single page
