LOUISIANA HAYNESVILLE SHALE—2: Economic operating envelopes characterized for Haynesville shale
View Article as Single page
Rate of return
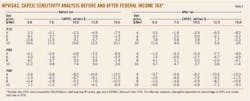
Pre- and posttax IRRs for the P10 and P50 wells depicted in Tables 2 and 3 are summarized in Tables 4 and 5. The signs and profit windows indicate a broad range of returns.
For $6/Mcf gas, average wells are expected to generate pretax returns between 1% and 11.5% for $1 to $0.50/Mcf OPEX and $7.5 million CAPEX. P10 wells are expected to generate a pretax return of 52-25% for $7.5 million to $10 million CAPEX and posttax returns of 20-40%. For $6/Mcf gas, average wells will generate a pretax return between 7.6% to 33% for $10 million to $7 million CAPEX and $0.50/Mcf OPEX.
Impact of first year prices
One of the most important factors in the success of a shale gas drilling program is the commodity price during the first year of production and, for Haynesville wells, the first several months after a well is brought on line is an important determinant in profitability.
This is not entirely unexpected, of course, and follows from the high initial production rates and steep decline curves characteristic of the play.
Although operators can shut in production in low price environments, invested capital requires a return and there are limitations on the ability to match output with high commodity prices.
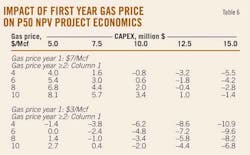
We assess the impact of first year prices on profitability. In Table 6, we assume the first year gas price is $7/Mcf followed by the prices depicted in column one for the second year forward. All other model assumptions are the same as in Table 2 for the before-tax P50 analysis.
The profit envelope expands significantly and NPV is greater for entries when gas prices are less than $7/Mcf. If first year gas price is $7/Mcf, even $4/Mcf future gas is economic for capital expenditures less than $7.5 million. When future gas prices are less than $7/Mcf project value will increase. If future gas prices are greater than $7/Mcf, however, project value will decrease because the first year price reduces the value of the well. For example, for $8/Mcf gas and $10 million CAPEX, Table 6 yields NPV = $2.0 million while Table 2 yields NPV = $3.3 million.
The difference in the individual components of Table 6 and Table 2 reflects the added value high first year prices provide. For $6/Mcf gas (year ≥2) and $7.5 million CAPEX, Table 6 yields a project value of $3.0 million, while Table 2 yields $1.6 million, a difference of $1.4 million due to the first year price differential.
If first year prices plummet to $3/Mcf when first production is achieved, the results are disastrous. The profit envelope shrinks significantly and even $10/Mcf future gas price will only recover marginal returns.
NEXT: The operating envelope under which Haynesville shale wells are profitable are expressed in functional form.
Displaying 5/5
View Article as Single page
More Oil & Gas Journal Current Issue Articles
More Oil & Gas Journal Archives Issue Articles
View Oil and Gas Articles on PennEnergy.com


