LOUISIANA HAYNESVILLE SHALE—2: Economic operating envelopes characterized for Haynesville shale
View Article as Single page
Model results
Gas price, capital expenditure
In Table 2, we vary gas price and capital expenditures and compute NPV fixing all other model parameters at their expected value, specifically, royalty rate at 25%, $9,000/acre lease cost, 80-acre well spacing, $1/Mcf operating expenses, 10% discount rate, 50% tangible expenditures, and 35% tax rate.
At $4/Mcf gas price, no value is created under most CAPEX scenarios except for P10 wells that can be brought in for less than $7.5 million. In the after-tax case, the $5 million well will create marginal value. To hold acreage in low price environments, operators target high quality shale prospects, but if the well comes in at average rate, it is unlikely to be economic.
At $6/Mcf gas price, P10 wells are profitable through capital expenditures of $12.5 million before-tax and $7.5 million after-tax. For P50 wells, the profit window shrinks and no value is created unless CAPEX is held under $10 million (before-tax) or $5 million (after-tax). As long as producers can maintain cost controls, the average well is likely to be profitable at $6/Mcf, and thus, $6/Mcf gas will stimulate activity and investment in the region.
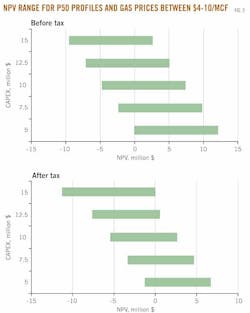
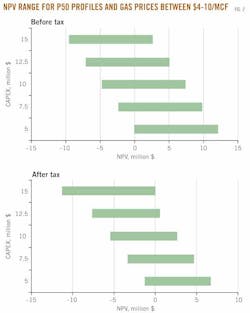
In Fig. 2, the NPV range for P50 wells as a function of capital expenditures for gas prices between $4 and $10/Mcf is shown. At $8/Mcf gas and higher, P10 wells are profitable for most of the capital expenditure scenarios depicted, while for the P50 well present value is positive through $12.5 million (before-tax) and $10 million (after-tax).
P90 wells will not make any money under any of the scenarios depicted except the unlikely combination of $10/Mcf gas price and $5 million CAPEX. P90 wells will not return their investors capital.
Capital expenditure, operating expenditure
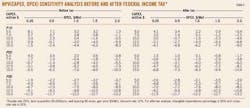
In Table 3, capital and operating expenditures are varied assuming a $5/Mcf gas price, 25% royalty rate, $9,000/ac lease cost, 80-acre well spacing, 10% discount rate, 50% tangible expenditures percentage, and 35% tax rate.
In the P10 stairs in the before-tax matrix, OPEX increases by $0.25/Mcf in the first horizontal increment, while CAPEX is reduced each vertical step by $2.5 million. Each step up expands the profit window because the reduction in upfront investment dominates the impact of the increase in OPEX over the life of the well.
According to the before-tax assessment, value is created when OPEX ≤ $1/Mcf and CAPEX ≤ $10 million, or when OPEX = $0.25/Mcf and CAPEX ≤ $12.5 million. Haynesville wells cannot be drilled and completed for less than about $7 million, so $5 million wells are not currently realistic. For P50 wells, the profit window shrinks considerably with value created only when CAPEX ≤ $7.5 million and OPEX ≤ $0.5/Mcf. All profit windows shrink when taxes are included.
Displaying 4/5
View Article as Single page


