Approach assesses waterflooding benefits in Egyptian oil field
View Article as Single page
Data integration
One of the biggest problems in reservoir engineering is having reliable and accurate data for identifying reserves, drive mechanism, recovery factor, and development plan.14 15
Reservoir data come from a variety of sources and need to be integrated to produce a complete picture of the reservoir. Crossing the traditional boundaries and integrating the work of geoscientists and engineers allows data resources to be better utilized.
The challenge is to know when to integrate and at what level the integration should be take place. The integration may be meaningless unless the integration can better identify reservoir properties and provide more accurate predictions of reservoir performance, leading to optimal hydrocarbon recovery.
In the case of Ferdaus, the cross section of the wells along with the tops of the Upper Bahariya units confirmed that the Upper Bahariya formation is a vertically isolated-stratified reservoir that includes five units: three productive sands and two shale units. Well-completion diagrams, perforated intervals, and production history showed that UB-2 and UB-3 are the main producing units in the Upper Bahariya formation.
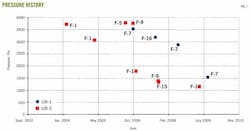
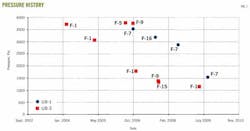
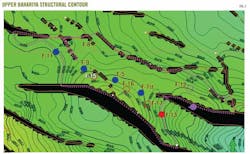
Pressure data when combined and integrated with the geologic interpretations of the Bahariya formation resulted in a more accurate description of reservoir characteristics. The historical pressure records for the Upper Bahariya formation (Fig. 1) were integrated with the location of the wells (Fig. 2). The following could be observed:
• Initial pressure of the two units was close, 3,500 psi for UB-2 and 3,700 psi for UB-3 psi.
• Reservoir pressures at the time of the study were about 1,500 psi for UB-2 and 1,100 for UB-3.
• No vertical communication existed between UB-2 and UB-3.
• Wells F-5 and F-9 at UB-3 showed initial pressure after some depletion from Well F-1. This may indicate the presence of a barrier between Well F-1 and other wells.
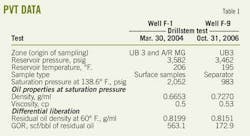
Table 1 summarizes the two available pressure-volume-temperature (PVT) data sets. The PVT data represent crude oil with two different characteristics. This difference may relate to different origins for taking the samples.
The average porosity and permeability of the two units are similar: 16% and 5 md, respectively.
The relative permeability data indicate a variation in the initial water saturation, which varies from 0.4 to 0.6. The data indicated that the initial water saturation increases with depth in UB-3.
Based on their perforated interval data and production history, Table 2 summarizes the production zones for Upper Bahariya producing wells F-1, F-5, F-7, F-9, F-15, and F-16ST2.


