P. 5 ~ Continued - World peak oil production still years away
View Article as Single page
Even though US supply was decreasing, world supply was stable and prices remained relatively constant from 1986 to 2005. The Hubbert model works as long as the price remains stable. But the world price is now ramping upwards, and this will change profoundly the dynamics of the Hubbert model.
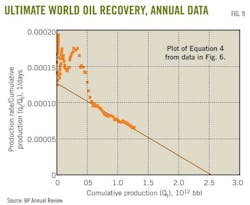
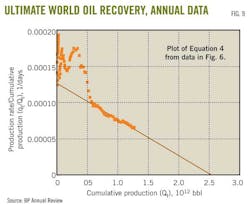
For example, Fig. 9 is a plot using Equation 4 of annual production data from Fig. 6. Extrapolating the data to the x-axis gives a Qmax of 2.54 trillion bbl. This compares with the 2 trillion bbl that Deffeyes got using this same data to 2005.
Between 2004 and 2010, oil price increased to $100/bbl from $20/bbl, and it became economic to develop the tight oil in the Bakken and Eagle Ford formations, the heavy oil sands in Canada, and the deepwater oil in the Gulf of Mexico and Santos basin. In fact, another half trillion bbl became economic to produce.
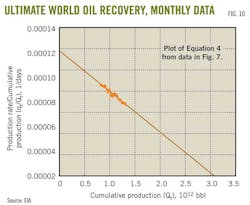
The monthly data (Fig. 7) in a similar plot extrapolate to 3.055 trillion bbl. Of this, 1.3 trillion bbl has been produced, leaving about 1.7 trillion bbl still to be found and produced.
EIA currently lists world oil proved reserves as 1.3 trillion bbl, meaning that only 400 billion bbl remain to be found.
These estimates are a function of oil price and likely conservative. But since this data are probably the most reliable available data, this estimate is probably the most reliable estimate under current economics.
It seems that more oil appears all the time. This is because of economics. If and when oil prices increase again and stay up, these values will increase again.
The exponential coefficient parameter a is from a plot of Equation 6. With this plot and monthly data from EIA, the value of a is 162.66. The y-axis intercept in Fig. 10 provides a value for b of 0.00011733 days–1.
Using these values of a and b in Equation 5 results in the peak rate occurring in 43,396 days from an arbitrary time zero, which in this case was Jan. 1, 1990. Oct. 23, 2018, is 43,396 days from time zero.
I am not saying that the world oil production will peak in October 2018 but that using Hubbert's model and EIA's monthly world oil production data results in a peak rate on Oct. 23, 2018.
If oil prices remain constant for the next 7 years and without major technological breakthroughs, this date may prove to be about accurate. But I do not expect that this will be the case and this date will probably move again.
Displaying 5/7
View Article as Single page


